
|
Focusing on what you can control can lead to a better investment experience. Whether you’ve been investing for decades or are just getting started, at some point on your investment journey you’ll likely ask yourself some of the questions below. Trying to answer these questions may be intimidating, but know that you’re not alone. While this is not intended to be an exhaustive list it will hopefully shed light on a few key principles, using data and reasoning, that may help improve investors’ odds of investment success in the long run. 1. What sort of competition do I face as an investor? The market is an effective information-processing machine. Millions of market participants buy and sell securities every day and the real-time information they bring helps set prices. This means competition is stiff and trying to outguess market prices is difficult for anyone, even professional money managers (see question 2 for more on this). This is good news for investors though. Rather than basing an investment strategy on trying to find securities that are priced “incorrectly,” investors can instead rely on the information in market prices to help build their portfolios (see question 5 for more on this). 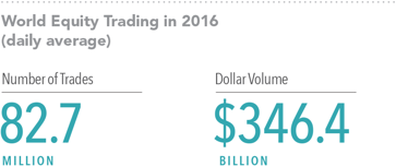 Source: World Federation of Exchanges members, affiliates, correspondents, and non-members. Trade data from the global electronic order book. Daily averages were computed using year-to-date totals as of December 31, 2016, divided by 250 as an approximate number of annual trading days. 2. What are my chances of picking an investment fund that survives and outperforms? Flip a coin and your odds of getting heads or tails are 50/50. Historically, the odds of selecting an investment fund that was still around 15 years later are about the same. Regarding outperformance, the odds are worse. The market’s pricing power works against fund managers who try to outperform through stock picking or market timing. One needn’t look further than real-world results to see this. Based on research*, only 17% of US equity mutual funds and 18% of fixed income funds have survived and outperformed their benchmarks over the past 15 years. 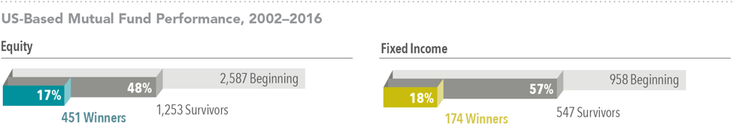 Source: *Mutual Fund Landscape 2017, Dimensional Fund Advisors. See Appendix for important details on the study. Past performance is no guarantee of future results. 3. If I choose a fund because of strong past performance, does that mean it will do well in the future? Some investors select mutual funds based on past returns. However, research shows that most funds in the top quartile (25%) of previous five-year returns did not maintain a top-quartile ranking in the following year. In other words, past performance offers little insight into a fund’s future returns. 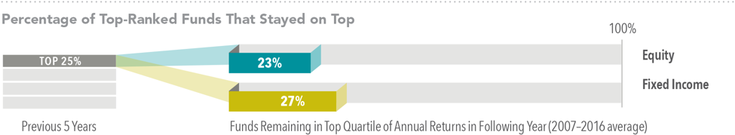 Source: *Mutual Fund Landscape 2017, Dimensional Fund Advisors. See Appendix for important details on the study. Past performance is no guarantee of future results. 4. Do I have to outsmart the market to be a successful investor? Financial markets have rewarded long-term investors. People expect a positive return on the capital they invest, and historically, the equity and bond markets have provided growth of wealth that has more than offset inflation. Instead of fighting markets, let them work for you. 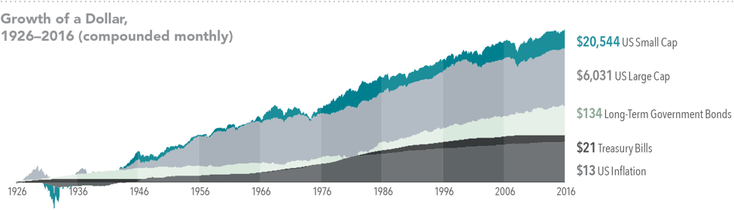 US Small Cap is the CRSP 6–10 Index. US Large Cap is the S&P 500 Index. Long-Term Government Bonds is the IA SBBI US LT Govt TR USD, provided by Ibbotson Associates via Morningstar Direct. Treasury Bills is the IA SBBI US 30 Day TBill TR USD, provided by Ibbotson Associates via Morningstar Direct. US Inflation is measured as changes in the US Consumer Price Index. US Consumer Price Index data is provided by the US Department of Labor Bureau of Labor Statistics. CRSP data is provided by the Center for Research in Security Prices, University of Chicago. The S&P data is provided by Standard & Poor’s Index Services Group. Indices are not available for direct investment. Index performance does not reflect the expenses associated with the management of an actual portfolio. Past performance is no guarantee of future results. 5. Is there a better way to build a portfolio? Academic research has identified these equity and fixed income dimensions, which point to differences in expected returns among securities. Instead of attempting to outguess market prices, investors can instead pursue higher expected returns by structuring their portfolio around these dimensions. 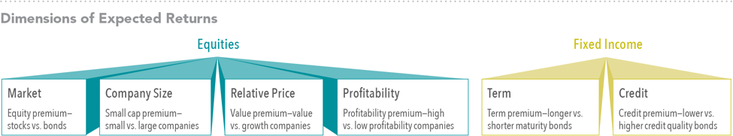 Relative price is measured by the price-to-book ratio; value stocks are those with lower price-to-book ratios. Profitability is a measure of current profitability based on information from individual companies’ income statements. 6. Is international investing for me? Diversification helps reduce risks that have no expected return, but diversifying only within your home market may not be enough. Instead, global diversification can broaden your investment opportunity set. By holding a globally diversified portfolio, investors are well positioned to seek returns wherever they occur. 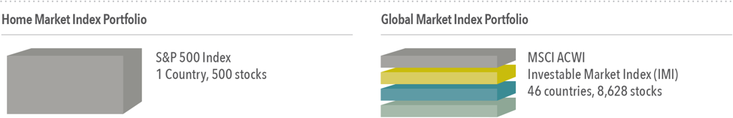 Number of holdings and countries for the S&P 500 Index and MSCI ACWI (All Country World Index) Investable Market Index (IMI) as of December 31, 2016. The S&P data is provided by Standard & Poor’s Index Services Group. MSCI data ©MSCI 2017, all rights reserved. International investing involves special risks such as currency fluctuation and political stability. Investing in emerging markets may accentuate those risks. Diversification does not eliminate the risk of market loss. Indices are not available for direct investment 7. Will making frequent changes to my portfolio help me achieve investment success? It’s tough, if not impossible, to know which market segments will outperform from period to period. Accordingly, it’s better to avoid market timing calls and other unnecessary changes that can be costly. Allowing emotions or opinions about short-term market conditions to impact long-term investment decisions can lead to disappointing results. 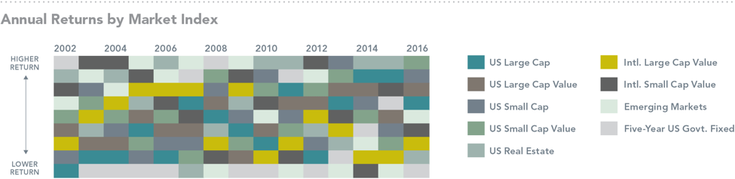 US Large Cap is the S&P 500 Index. US Large Cap Value is the Russell 1000 Value Index. US Small Cap is the Russell 2000 Index. US Small Cap Value is the Russell 2000 Value Index. US Real Estate is the Dow Jones US Select REIT Index. International Large Cap Value is the MSCI World ex USA Value Index (net dividends). International Small Cap Value is the MSCI World ex USA Small Cap Value Index (net dividends). Emerging Markets is the MSCI Emerging Markets Index (net dividends). Five-Year US Government Fixed is the Bloomberg Barclays US TIPS Index 1–5 Years. The S&P data is provided by Standard & Poor’s Index Services Group. Frank Russell Company is the source and owner of the trademarks, service marks, and copyrights related to the Russell Indexes. Dow Jones data provided by Dow Jones Indices. MSCI data ©MSCI 2017, all rights reserved. Bloomberg Barclays data provided by Bloomberg. Indices are not available for direct investment. Index performance does not reflect the expenses associated with the management of an actual portfolio. Past performance is no guarantee of future results. 8. Should I make changes to my portfolio based on what I’m hearing in the news? Daily market news and commentary can challenge your investment discipline. Some messages stir anxiety about the future, while others tempt you to chase the latest investment fad. If headlines are unsettling, consider the source and try to maintain a long-term perspective. 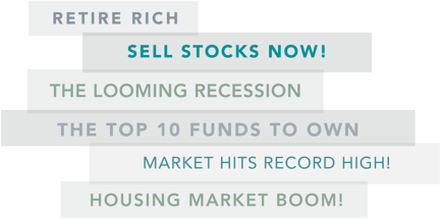 9. So, what should I be doing? Work closely with a financial advisor who can offer expertise and guidance to help you focus on actions that add value. Focusing on what you can control can lead to a better investment experience.
APPENDIX
Question 2: The sample includes US-based funds at the beginning of the 15-year period ending December 31, 2016. Each fund is evaluated relative to the Morningstar benchmark assigned to the fund’s category at the start of the evaluation period. Surviving funds are those with return observations for every month of the sample period. Winner funds are those that survived and whose cumulative net return over the period exceeded that of their respective Morningstar category benchmark. Question 3: At the end of each year, funds are sorted within their category based on their five-year total return. Funds in the top quartile (25%) of returns are evaluated again in the following year based on one-year performance in order to determine the percentage of funds that maintained a top-quartile ranking. The analysis is repeated each year from 2007–2016. The chart shows average persistence of top-quartile funds during the 10-year period. Questions 2 and 3: US-domiciled open-end mutual fund data is from Morningstar and Center for Research in Security Prices (CRSP) from the University of Chicago. Index funds and fund-of-funds are excluded from the sample. Equity fund sample includes the Morningstar historical categories: Diversified Emerging Markets, Europe Stock, Foreign Large Blend, Foreign Large Growth, Foreign Large Value, Foreign Small/Mid Blend, Foreign Small/Mid Growth, Foreign Small/Mid Value, Japan Stock, Large Blend, Large Growth, Large Value, Mid- Cap Blend, Mid-Cap Value, Miscellaneous Region, Pacific ex-Japan Stock, Small Blend, Small Growth, Small Value, and World Stock. Fixed income fund sample includes the Morningstar historical categories: Corporate Bond, Inflation-Protected Bond, Intermediate Government, Intermediate-Term Bond, Muni California Intermediate, Muni National Intermediate, Muni National Short, Muni New York Intermediate, Muni Single State Short, Short Government, Short-Term Bond, Ultrashort Bond, and World Bond. For additional information regarding the Morningstar historical categories, please see “The Morningstar Category Classifications”at morningstardirect.morningstar.com/clientcomm/Morningstar_Categories_US_April_2016.pdf. See Dimensional’s “Mutual Fund Landscape 2017” for more detail. Benchmark data provided by Bloomberg Barclays, MSCI, Russell, Citigroup, and S&P. Bloomberg Barclays data provided by Bloomberg. MSCI data © MSCI 2017, all rights reserved. Frank Russell Company is the source and owner of the trademarks, service marks, and copyrights related to the Russell Indexes. Citi fixed income indices © 2017 by Citigroup. The S&P data is provided by Standard & Poor’s Index Services Group. Source: Dimensional Fund Advisors LP. Indices are not available for direct investment. Their performance does not reflect the expenses associated with the management of an actual portfolio. Past performance is not a guarantee of future results. Diversification does not eliminate the risk of market loss. There is no guarantee investment strategies will be successful. Investing involves risks including possible loss of principal. Investors should talk to their financial advisor prior to making any investment decision. All expressions of opinion are subject to change. This article is distributed for informational purposes, and it is not to be construed as an offer, solicitation, recommendation, or endorsement of any particular security, products, or services. Investors should talk to their financial advisor prior to making any investment decision. |
|
Phone: 860-837-0303
|
Message: [email protected]
|
|
WINDSOR
360 Bloomfield Ave 3rd Floor Windsor, CT 06095 |
WEST HARTFORD
15 N Main St #100 West Hartford, CT 06107 |
SHELTON
One Reservoir Corporate Centre 4 Research Dr - Suite 402 Shelton, CT 06484 |
ROCKY HILL
175 Capital Boulevard 4th Floor Rocky Hill, CT 06067 |
Home I Who We Are I How We Invest I Portfolios I Financial Planning I Financial Tools I Wealth Management I Retirement Plan Services I Blog I Contact I FAQ I Log In I Privacy Policy I Regulatory & Disclosures

|

|

|
|

|

|

|
© 2024 WealthShape. All rights reserved.