|
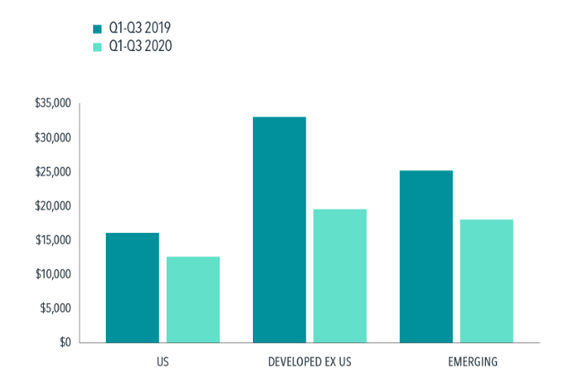
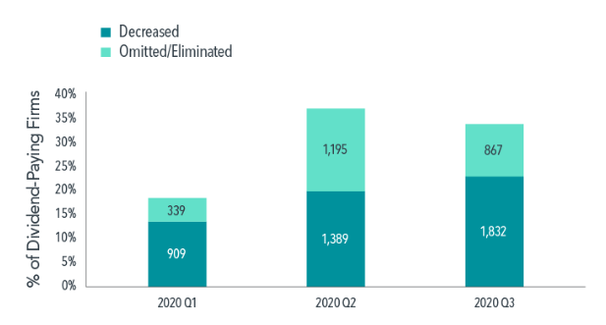
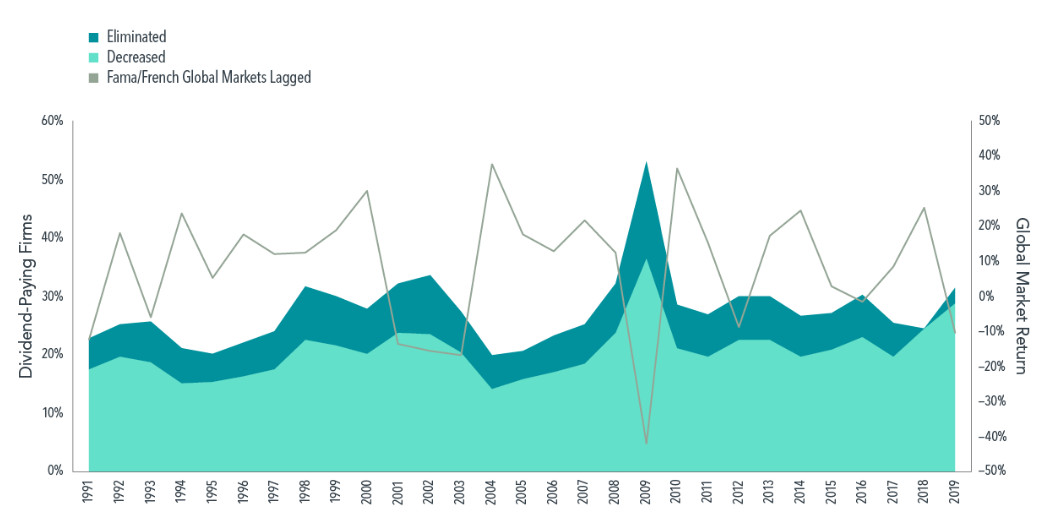
Many investors view dividend payouts as a reliable source of income. However, those expecting to receive consistent dividend income may have been surprised to see lower- than-expected dividend payouts following the onset of the coronavirus pandemic, when both market volatility and market declines were extraordinary. In reality, recent and historical data show that changes in dividend policy are common, especially during times of higher uncertainty. Aggregate dividend payouts fell meaningfully in the first three quarters of 2020 compared to the same period in 2019. Exhibit 1 shows the dividends earned from a hypothetical $1 million investment in US, developed ex US, and emerging markets in both periods. Developed ex US markets showed the most drastic change with a 41% decrease. Dividend payments in emerging markets decreased by 29% and in US markets by 22%. Exhibit 1 Drop Zone Dividends from a Hypothetical $1 Million Investment Globally, large firms have historically had the highest propensity to offer dividend payouts,1 but even successful, established firms were not immune to the economic consequences of a global pandemic. A few examples help illustrate this point. Harley Davidson (HOG) has been paying dividends to shareholders since the 1990s. In April 2020, the motorcycle manufacturer slashed its dividend from $0.38 per share to just $0.02, a 95% decrease.2 Gap Inc. (GPS) suspended its dividend payments until at least April 20213 after the economic downturn left the clothing brand with particularly poor revenues. Harley Davidson and Gap were not the only firms to change their dividend policies. As shown in Exhibit 2, 38% of firms in global markets (2,584 companies) that were expected to pay dividends, consistent with their payout history, instead decreased, omitted, or eliminated their dividend payments in the second quarter, more than doubling the 1,248 firms that made similar changes to their dividend policy in the first quarter of the year. The trend continued into the third quarter: 2,699 firms made such changes. Exhibit 2 Changing Tune Dividend Policy Changes in Global Markets (% of Dividend- Paying Firms), 2020 While these dividend cuts may come as a surprise to some investors, history buffs may recall that, in 2009, Harley Davidson announced it was cutting dividend payouts from $0.33 per share to $0.10, a 70% decrease.4 In fact, during the Great Recession, significant changes to firms’ dividend policies spiked throughout global markets. Exhibit 3 displays Fama/French global market returns for 1991–2019 with a one-year lag and the proportion of dividend-paying firms that eliminated or decreased their dividend payouts. In 2008, for example, the global market was down more than 40%, and, the following year, many firms made changes to their dividend policies. The historical correlation between global market returns and dividends that are eliminated or decreased may suggest that firms are more likely to alter their dividend payouts during times of market instability. Exhibit 3 In Step Global Market Returns and Dividend Changes The first three quarters of 2020 remind us that dividend payouts can be inconsistent, particularly in volatile markets. Hence, investment strategies that focus on income derived from dividends may not serve investors who need a steady income stream and, moreover, might not be the most effective way to pursue long-term wealth growth. A more reliable approach is to structure equity asset allocation around the characteristics that research demonstrates drive long-term higher expected returns, namely size, relative price, and profitability, while maintaining broad diversification across names, sectors, and countries. All data is from sources believed to be reliable but cannot be guaranteed or warranted. This information is intended for educational purposes, and it is not to be construed as an offer, solicitation, recommendation, or endorsement of any particular security, products, or services. No one should assume that any discussion or information contained in this material serves as a receipt of, or as a substitute for, personalized investment, tax or legal advice. Diversification does not eliminate the risk of market loss. Investment risks include loss of principal and fluctuating value. Past performance is not a guarantee of future results. Indices are not available for direct investment; therefore, their performance does not reflect the expenses associated with the management of an actual portfolio.
Dividends in the Time of COVID-19 FOOTNOTES 1Stanley Black, “Global Dividend-Paying Stocks: A Recent History” (white paper, Dimensional Fund Advisors, March 2013). 2Harley-Davidson, Inc., “Dividends & Stock Splits,” investor.harley-davidson.com/stock-info/dividends-and-stock-split. 3Gap Inc., “Gap Inc. Provides Update In Response To Covid-19 Outbreak,” news release, March 26, 2020, investors.gapinc.com/press-releases/news-details/2020/GAP-INC-PROVIDES-UPDATE-IN-RESPONSE-TO-COVID-19-OUTBREAK/default.aspx 4Harley-Davidson, Inc., “Dividends & Stock Splits.” Exhibit 1 Source: Calculated by Dimensional from Bloomberg data. In USD. Each hypothetical investment includes all securities in the investable equity universe in the applicable region at free-float market cap weight as determined at the beginning of each year. To be included in the investable equity universe, securities must meet certain minimum capitalization and liquidity requirements. Investment companies are excluded. Exhibit 2 Source: Calculated by Dimensional from Bloomberg data. Dividend-paying firms include all firms that have paid a dividend in the preceding 12 months and were expected to pay a dividend in the current quarter. Exhibit 3 Note: Global Market return is free-float market cap weighted average of Fama/French Developed Markets and Emerging Markets Indexes. See Index Descriptions in the disclosures for descriptions of Fama/French index data. Source: Calculated by Dimensional from Bloomberg data. Past performance is no guarantee of future results. Dividend- paying firms include all firms that paid a dividend in the prior calendar year. The information in this material is intended for the recipient’s background information and use only. It is provided in good faith and without any warranty or, representation as to accuracy or completeness. Information and opinions presented in this material have been obtained or derived from sources believed by the Issuing Entity to be reliable and the Issuing Entity has reasonable grounds to believe that all factual information herein is true as at the date of this document. It does not constitute investment advice, recommendation, or an offer of any services or products for sale and is not intended to provide a sufficient basis on which to make an investment decision. It is the responsibility of any persons wishing to make a purchase to inform themselves of and observe all applicable laws and regulations. Unauthorised reproduction or transmitting of this material is strictly prohibited. The Issuing Entity does not accept responsibility for loss arising from the use of the information contained herein. Eugene Fama and Ken French are members of the Board of Directors of the general partner of, and provide consulting services to, DFAL and DIL. In USD. Index DescriptionsFama/French Developed Markets Index: July 1990–present: Courtesy of Fama/French from Bloomberg securities data. Companies weighted by market cap; rebalanced annually in June. Fama/French Emerging Markets Index: July 1989–present: Courtesy of Fama/French from Bloomberg and IFC securities data. Companies weighted by float-adjusted market cap; rebalanced annually in June. |
By Tim Baker, CFP®Advice and investment design should rely on long term, proven evidence. This column is dedicated to helping investors across the country, from all walks of life to understand the benefits of disciplined investing and the importance of planning. Archives
December 2023
|
|
Phone: 860-837-0303
|
Message: [email protected]
|
|
WINDSOR
360 Bloomfield Ave 3rd Floor Windsor, CT 06095 |
WEST HARTFORD
15 N Main St #100 West Hartford, CT 06107 |
SHELTON
One Reservoir Corporate Centre 4 Research Dr - Suite 402 Shelton, CT 06484 |
ROCKY HILL
175 Capital Boulevard 4th Floor Rocky Hill, CT 06067 |
Home I Who We Are I How We Invest I Portfolios I Financial Planning I Financial Tools I Wealth Management I Retirement Plan Services I Blog I Contact I FAQ I Log In I Privacy Policy I Regulatory & Disclosures
© 2024 WealthShape. All rights reserved.


