
|
“I knew the market was going to crash.” It’s a common investment expression that you’ve likely heard plenty of times. However, is there any reason to take such statements seriously? Hindsight bias has been deceiving investors for years. Once we’ve had time to digest information, it can often seem like yesterday’s news should have been more predictable. Perhaps the best way to avoid behavioral hazards is to first acknowledge that they exist. Recognizing what we really know versus what’s unknowable may be the single most important investment decision we ever make. 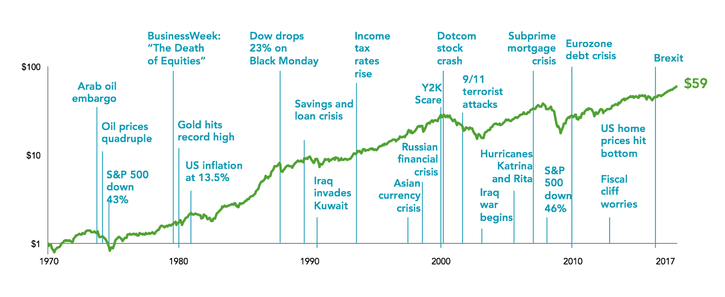 The history of stock markets is filled with ups and downs which after the fact appear to be easily identified. The huge leverage risk-taking by banking/investment and insurance firms leading up to the 2008 financial crisis is blatantly visible today. We’ve had the benefit of 10 years to reflect. Nobel prize-winning psychologist, Daniel Kahneman would say, it’s during this time of careful observation that hindsight creates an illusion of understanding. Essentially our brains screw up the timeline. Signs of danger appear more obvious after the fact than they were in real time. In 2008, a variety of dominoes had to fall on the way to peak awareness. When it became evident that the housing market was bolstered by bad loans with roots extending across the financial spectrum, markets reacted exactly as they should. They priced in the new information and the results were painful. Investing in 20/20 hindsight can lead to an even more detrimental exercise in creating a misconception that future events are coming based on information that is wholly unknowable. This is evidenced by an unending flow of soothsaying from financial media outlets. A few examples: October 20th 1987 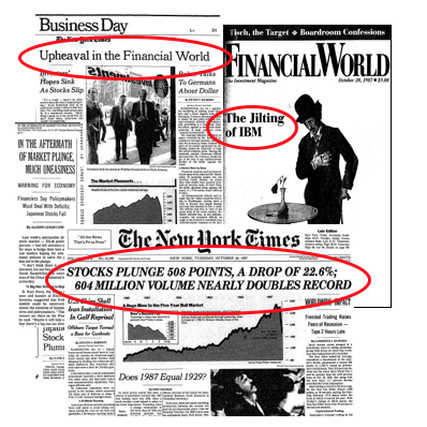 One Day later: October 21st 1987 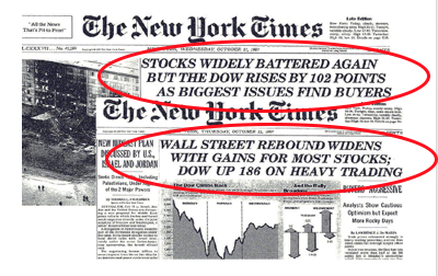 One of the single best days in market history was October 21, 1987, only two days after the Black Monday market crash. The S&P 500 was up 9.10%
So much time and energy focuses on things that are unknowable in the moment. News by definition is unpredictable. Therefore, any action taken as an investor must answer the following: “What are the chances that I know something that everyone else doesn’t? Furthermore, even if I do know something, how long will I be the only one? And finally, what are the chances that my information has already been incorporated into current market values?” Today we carry more computing power in our pockets than all of NASA did when it put the first men on the moon in 1969. Needless to say, news travels at an incredible speed. By the time it reaches you and me, it’s almost a certainty that markets have already incorporated the latest news into prices. This simple fact demonstrates the value or lack thereof for opinions based on past events. Investors should remain conscious of the brain’s tendency to value “known information” as if it were “unknown.” By doing so, we can better combat the impacts of hindsight decision making. What’s an investor to do? It’s folly to suggest in retrospect that market prices were wrong because they were never perfect in the first place. Their primary role is to provide the best representation of all available information at the moment. It’s a far better exercise to follow the preponderance of evidence we know exists. Markets tend to be resilient to crisis over the long term and investors have historically been rewarded for maintaining behavioral discipline. Therefore, an accurate forecast of future events isn't a prerequisite for success. The Market’s Response to Crisis Performance of a Balanced Strategy: 60% Stocks, 40% Bonds (Cumulative Total Return) 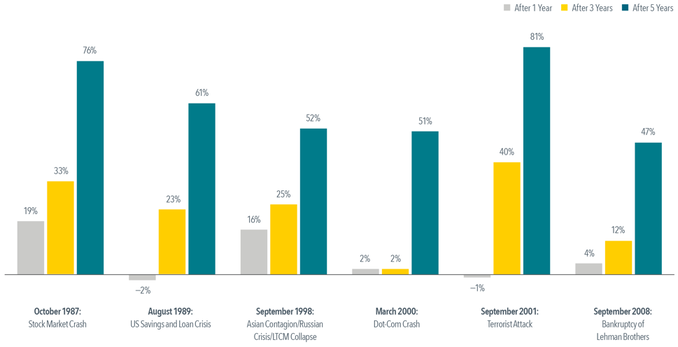 In US dollars. Represents cumulative total returns of a balanced strategy invested on the first day of the following calendar month of the event noted. Balanced Strategy: 12% S&P 500 Index,12% Dimensional US Large Cap Value Index, 6% Dow Jones US Select REIT Index, 6% Dimensional International Marketwide Value Index, 6% Dimensional US Small Cap Index, 6% Dimensional US Small Cap Value Index, 3% Dimensional International Small Cap Index, 3% Dimensional International Small Cap Value Index, 2.4% Dimensional Emerging Markets Small Index, 1.8% Dimensional Emerging Markets Value Index, 1.8% Dimensional Emerging Markets Index, 10% Bloomberg Barclays Treasury Bond Index 1-5 Years, 10% Citigroup World Government Bond Index 1-5 Years (hedged), 10% Citigroup World Government Bond Index 1-3 Years (hedged), 10% BofA Merrill Lynch 1-Year US Treasury Note Index. The S&P data are provided by Standard & Poor’s Index Services Group. The Merrill Lynch Indices are used with permission; copyright 2017 Merrill Lynch, Pierce, Fenner & Smith Incorporated; all rights reserved. Citigroup Indices used with permission, © 2017 by Citigroup. Bloomberg Barclays data provided by Bloomberg. For illustrative purposes only. Dimensional indices use CRSP and Compustat data. Indices are not available for direct investment. Their performance does not reflect the expenses associated with the management of an actual portfolio. Past performance is not a guarantee of future results. Not to be construed as investment advice. Rebalanced monthly. Returns of model portfolios are based on back-tested model allocation mixes designed with the benefit of hindsight and do not represent actual investment performance.  All data is from sources believed to be reliable but cannot be guaranteed or warranted. This information is intended for educational purposes, and it is not to be construed as an offer, solicitation, recommendation, or endorsement of any particular security, products, or services. No one should assume that any discussion or information contained in this material serves as a receipt of, or as a substitute for, personalized investment, tax or legal advice. Diversification does not eliminate the risk of market loss. Investment risks include loss of principal and fluctuating value. Past performance is not a guarantee of future results. Indices are not available for direct investment; therefore, their performance does not reflect the expenses associated with the management of an actual portfolio.
The Market Response to Crisis Source: Dimensional Fund Advisors LP. Past performance is no guarantee of future results. There is no guarantee an investing strategy will be successful. Investing involves risks including possible loss of principal. Diversification does not eliminate the risk of market loss. Indices are not available for direct investment. Their performance does not reflect the expenses associated with the management of an actual portfolio. All expressions of opinion are subject to change. This article is distributed for informational purposes, and it is not to be construed as an offer, solicitation, recommendation, or endorsement of any particular security, products, or services. Investors should talk to their financial advisor prior to making any investment decision. Eugene Fama and Ken French are members of the Board of Directors of the general partner of, and provide consulting services to, Dimensional Fund Advisors LP. |
|
Phone: 860-837-0303
|
Message: [email protected]
|
|
WINDSOR
360 Bloomfield Ave 3rd Floor Windsor, CT 06095 |
WEST HARTFORD
15 N Main St #100 West Hartford, CT 06107 |
SHELTON
One Reservoir Corporate Centre 4 Research Dr - Suite 402 Shelton, CT 06484 |
ROCKY HILL
175 Capital Boulevard 4th Floor Rocky Hill, CT 06067 |
Home I Who We Are I How We Invest I Portfolios I Financial Planning I Financial Tools I Wealth Management I Retirement Plan Services I Blog I Contact I FAQ I Log In I Privacy Policy I Regulatory & Disclosures

|

|

|
|

|

|

|
© 2024 WealthShape. All rights reserved.