
|
By Jim Parker Vice President, Dimensional Fund Advisors When news breaks and markets move, content-starved media often invite talking heads to muse on the repercussions. Knowing the difference between this speculative opinion and actual facts can help investors stay disciplined during purported “crises.” At the end of June this year, UK citizens voted in a referendum for the nation to withdraw from the European Union. The result, which defied the expectations of many, led to market volatility as participants weighed possible consequences. Journalists responded by using the results to craft dramatic headlines and stories. The Washington Post said the vote had “escalated the risk of global recession, plunged financial markets into free fall, and tested the strength of safeguards since the last downturn seven years ago.”1 The Financial Times said “Brexit” had the makings of a global crisis. “[This] represents a wider threat to the global economy and the broader international political system,” the paper said. “The consequences will be felt across the world.”2 It is true there have been political repercussions from the Brexit vote. Theresa May replaced David Cameron as Britain’s prime minister and overhauled the cabinet. There are debates in Europe about how the withdrawal will be managed and the possible consequences for other EU members. But within a few weeks of the UK vote, Britain’s top share index, the FTSE 100, hit 11-month highs. By mid-July, the US S&P 500 and Dow Jones Industrial Average had risen to record highs. Shares in Europe and Asia also strengthened after dipping initially following the vote. Yes, the Brexit vote did lead to initial volatility in markets, but this has not been exceptional or out of the ordinary. One widely viewed barometer is the Chicago Board Options Exchange Volatility Index (VIX). Using S&P 500 stock index options, this index measures market expectations of near-term volatility. 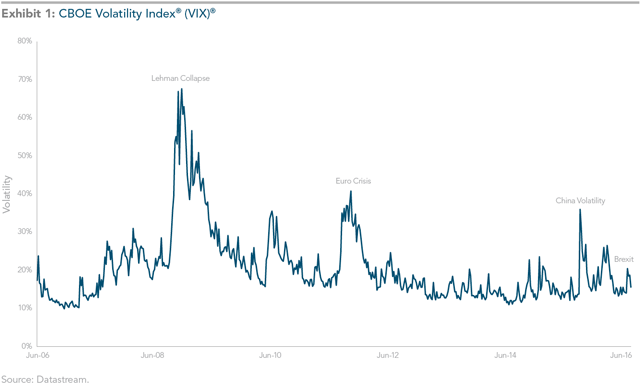 You can see by the chart above that while there was a slight rise in volatility around the Brexit result, it was insignificant relative to other major events of recent years, including the collapse of Lehman Brothers, the eurozone crisis of 2011, and the severe volatility in the Chinese domestic equity market in 2015. None of this is intended to downplay the political and economic difficulties of Britain leaving the European Union, but it does illustrate the dangers of trying to second-guess markets and base an investment strategy on speculation. Now the focus of speculation has turned to how markets might respond to the US presidential election. CNBC recently reported that surveys from Wall Street investment firms showed “growing concern” over how the race might play out.3 Given the examples above, would you be willing to make investment decisions based on this sort of speculation, particularly when it comes from the same people who pronounced on Brexit? And remember, not only must you correctly forecast the outcome of the vote, you have to correctly guess how the market will react. What we do know is that markets incorporate news instantaneously and that your best protection against volatility is to diversify both across and within asset classes, while remaining focused on your long-term investment goals. The danger of investing based on recent events is that the situation can change by the time you act. A “crisis” can morph into something far less dramatic, and you end up responding to news that is already in the price. Journalism is often described as writing history on the run. Don’t get caught investing the same way. 1. “Brexit Raises Risk of Global Recession as Financial Markets Plunge,” Washington Post, June 24, 2016.
2. “Brexit and the Making of a Global Crisis,” Financial Times, June 25, 2016. 3. “Investors are Finally Getting Nervous about the Election,” CNBC, July 13, 2016. Virtually every investment disclosure includes some variation of the following statement: “past performance is no guarantee of future results.” Very few investors pay any attention to those words, but more should. Not only because they give further information about the data that’s being presented, but also because of the reason these statements are included. Is evaluating past performance the best way to select mutual funds? Do Outperforming US Equity Mutual Funds persist? 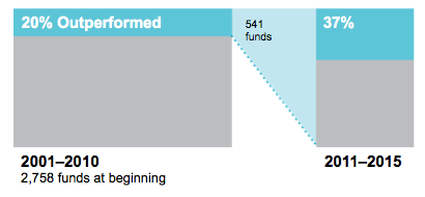 The research offers strong evidence to the contrary. This chart illustrates the lack of persistence in outperformance among US equity mutual funds. The funds are evaluated based on their 10-year track records (2001-2010), and those that beat their respective benchmarks are re-evaluated in the subsequent five-year period (2011-2015). Among the 2,758 equity funds that began the initial 10-year period, only 20% outperformed—and among these 541 winning funds, only 37% continued to beat their benchmarks in the subsequent five-year period. Some US equity fund managers may be better than others, but this evidence shows the extreme difficulties in identifying them in advance using track records alone. Returns contain a lot of noise, and impressive track records often result from good luck. The assumption that past outperformance will continue often proves faulty and leaves many investors disappointed. Investment evaluation should embrace a variety of additional metrics including but not limited to the funds strategy: taking into account empirical rationale and economic intuition, cost, style drift and of course overall risk. It’s also critical that any evaluation take into consideration how your overall portfolio is impacted by the addition or subtraction of a fund. The graph shows the proportion of US equity mutual funds that outperformed and underperformed their respective benchmarks (i.e., winners and losers) during the initial 10-year period ending December 31, 2010. Winning funds were re-evaluated in the subsequent five-year period from 2011 through 2015, with the graph showing winners (outperformers) and losers (underperformers). Fund count and percentages may not correspond due to rounding. Past performance is no guarantee of future results. Data Source: Analysis conducted by Dimensional Fund Advisors using data on US-domiciled mutual funds obtained from the CRSP Survivor-Bias-Free US Mutual Fund Database, provided by the Center for Research in Security Prices, University of Chicago. Sample excludes index funds. Benchmark data provided by MSCI, Russell, and S&P. MSCI data © MSCI 2016, all rights reserved. Russell data © Russell Investment Group 1995-2016, all rights reserved. The S&P data are provided by Standard & Poor’s Index Services Group. Benchmark indices are not available for direct investment. Their performance does not reflect the expenses associated with the management of an actual portfolio. Mutual fund investment values will fluctuate, and shares, when redeemed, may be worth more or less than their original cost. Diversification neither assures a profit nor guarantees against a loss in a declining market.
|
|
Phone: 860-837-0303
|
Message: [email protected]
|
|
WINDSOR
360 Bloomfield Ave 3rd Floor Windsor, CT 06095 |
WEST HARTFORD
15 N Main St #100 West Hartford, CT 06107 |
SHELTON
One Reservoir Corporate Centre 4 Research Dr - Suite 402 Shelton, CT 06484 |
ROCKY HILL
175 Capital Boulevard 4th Floor Rocky Hill, CT 06067 |
Home I Who We Are I How We Invest I Portfolios I Financial Planning I Financial Tools I Wealth Management I Retirement Plan Services I Blog I Contact I FAQ I Log In I Privacy Policy I Regulatory & Disclosures

|

|

|
|

|

|

|
© 2024 WealthShape. All rights reserved.