|
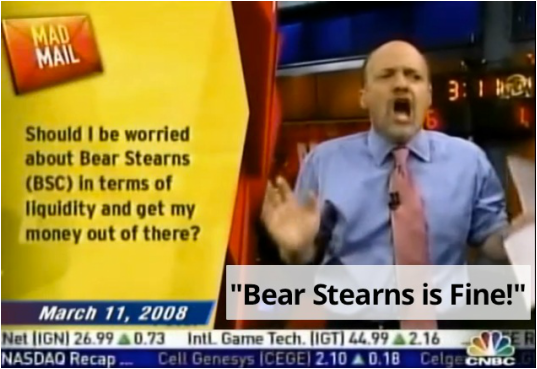
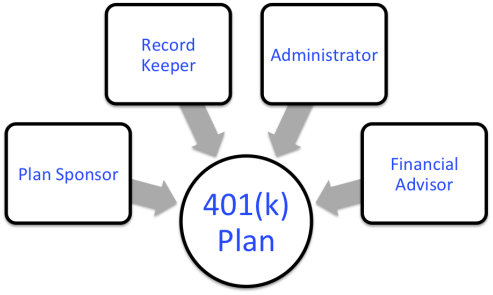
A few days ago a working study was released talking about CNBC Mad Money host Jim Cramer’s inability to beat the market as measured by the S&P 500 over the last 15 years. It’s hardly the first time someone has taken a shot at him. I suspect it coincided with the timely release of the movie “Money Monster” where George Clooney plays a character said to be inspired by Cramer. The popular show which began in 2005 has included segments such as “Am I diversified”, Lightening Round” and “Pick of the week”. I get his shtick and have even been told by folks who know Jim that he’s an incredibly nice guy. What continues to boggle my mind is this: in spite of all the evidence, some viewers still look to the show for advice. In his own words Cramer defines “mad money” as the money one “can use to invest in stocks ... not retirement money, which you want in 401K or an IRA, a savings account, bonds, or the most conservative of dividend-paying stocks.” The intention here isn’t to smear Jim Cramer or his popular show. There are certainly instances when sound logic is displayed. He’s openly suggested individuals should refrain from choosing actively managed mutual funds, sighting their underperformance vs. standard benchmarks over long periods of time. Unfortunately sound advice doesn’t keep viewers entertained for long. Setting aside the overly dramatic antics that dominate the show, have viewers actually benefitted from his expertise? According to the study just released out of the Wharton School of Business at the University of Pennsylvania, Cramer’s Action Alerts Plus portfolio has underperformed the S&P 500 index in terms of total cumulative returns since its 2001. The portfolio he co-manages is a buy/sell strategy found on the financial website he started. The site also features a subscription service, which includes an exclusive Cramer market commentary. You be the judge as to whether he helps or hinders investor behavior. I lean towards the latter, but give the guy credit for his high energy and entertainment value. Obviously he’s the main reason for the shows popularity. However, CNBC isn’t in the investment business. They don’t directly generate revenue from investment management or even advice. That comes from advertisers. Naturally, a larger viewing audience helps their cause. The concept of 401(k) retirement funding is simple enough but very few truly understand how their plan actually works and why they should care. New light has been shed on these employer sponsored retirement plans with the recent passing of the department of labors (DOL) fiduciary rule. When the rule goes into full affect over the next year or so, all financial advice provided to retirement plans will require “Fiduciary” best interests practices. It’s clear; the DOL’s intention was to increase transparency in an environment where so much is unclear. For many investors’ 401(k)’s represent the primary retirement funding vehicle. This column will attempt to decode their complex components in plain English. Plan Sponsor: Your Boss. The business owner at some point decided to establish a retirement plan for the benefit of their employees. Participants in the plan receive tax differed growth plus the added benefit of some percentage of employer matching contributions. The plan sponsor in turn gets a strong recruitment vehicle for attracting employees and tax deductions for plan contributions. Record Keeper: Tracks the assets in retirement plans. They do a lot of other things but their main role is to track how much money you have and where it is allocated. Lot’s of types of money goes into the plan. The record keeper tracks what are salary deferrals (pre-tax or post tax), employer matching contributions, profit sharing contributions, rollovers etc. Administrator: Their function is really the day-to-day operation of the plan including all paperwork, document filing, and testing to keep the plan compliant with all IRS non-discrimination requirements. Financial Advisor: Selects the investments that go into the plan, monitors them for necessary changes and provides oversight and ongoing evaluations of the record keeper and administrator so that the plan sponsor can focus on the business. Ok, so those are the players involved. Here’s where it gets confusing. The fees for these services are often blended together. One specific entity can act in multiple capacities and the cost of these services isn’t always explicitly stated. In most cases you have to dig deep to find out what you’re really paying, as there isn't always a separate invoice for each item. Whether paid by the employer, the employee of both, these costs are real. The trick is finding them. Here’s how.
408(b)(2) Fee Disclosure: Spells out the direct and indirect compensation paid to all service providers. Every plan has one of these documents. When the regulators passed this disclosure requirement a few year back, the intention was again transparency. While this is a great starting point, reading one of these things can look like hieroglyphics even to the trained eye. Nonetheless, it is solid reference for understanding the all in plan costs. It usually comes with the plans annual report which any HR department should have no trouble providing. Fund Expense Ratios: If you still can’t figure out your plans expenses, here’s where you’re most likely to find the smoking gun. When you enrolled in your 401(k) you likely made selections from the list of investment options available. Every single one of those options has expenses associated with it, as indicated by the internal expense ratio. Well, not that entire fee is for the operation of the fund. Some of it is often parceled out to other parties such as the record keeper or administrator. Additionally, I often see mutual fund share classes, which contain commissions or 12b-1 fees that end up going to the financial advisor attached to the plan. As mentioned previously, the DOL has focused its attention on the imprudence of adding commissionable products to retirement plans with the passing of the fiduciary rule requiring advisors to act in the best interest of the plan. In essence the fees for the service providers to the plan can be buried in the expenses of the very funds you select. This causes many participants to think they’re paying next to nothing for their 401(k) plans. Just because fees are difficult to see, doesn’t mean they don’t exist. While I firmly stand as a staunch advocate for transparency, the bundling of these costs isn’t necessarily a bad thing, given they're understandable and reasonable when compared to other plans that are similar to your own. 401(k)’s represent an estimated $4.4 trillion in retirement assets. For years the complexity associated with them has fueled the complacency of employers and employees. Today, I receive more questions than ever, as informed investors take a new interest in decoding their retirement plans. Feature Investopedia Column By Tim Baker It’s the most sought after information in the investment world: where do returns come from? “Expected return” represents the reward an investor can expect for the level of risk they’re willing to take. In truth, the pursuit of expected return really isn’t a search for return itself, but rather the reliable information that helps us to understand what determines it. The journey begins at the intersection of technology and financial science. Thanks to technology’s evolutionary ability to harness massive amounts of data, we know more today than we ever have. With so many ways to evaluate any particular company, the question is: which factors matter most, and which provide the most credible evidence across time, geography and asset class? The objective approach that financial science takes turns a blind eye to the name or even the reputation of any one company. It only cares about the search for reliable information that’s too concrete to dismiss. Over the last 60 years we’ve learned a lot about factors that influence expected return. Research has shown that over 90% of a diversified portfolio’s returns can be explained by its exposure to the market as a whole, to the relative size of the companies within the portfolio, and to their current market trading prices relative to the book value of all their assets. Where Do Returns Come From? Let’s break that down. Why do these factors help us understand where expected return comes from? Start with this simple premise. There are two primary ways to invest in any stock exchange-listed company. Buy equity (stock), or buy debt (bonds). Basically, both are loans where investors supply a company with capital. Your incentive lies with the belief that a return on investment is probable. The tradeoff is your acceptance of risk, for the chosen company’s acceptance of funding. Exposure to the market: So why are stocks riskier than bonds? Bond holders have priority claims at dissolution over stocks. All that means is if a company goes out of business, bond holders get paid first. Whatever’s left goes to the remaining stock holders. This is the generally accepted reason why stocks are riskier than bonds. Furthermore, it’s also the reason why investors should require a bigger potential reward for investing in them. Over the long history of capital markets, stocks have collectively outperformed bonds. Exposure to small-cap stocks: Investing in the market is reasonable for most investors if they are willing to accept the risk/reward tradeoff. Now, what specific types of companies exhibit higher levels of risk? Consider the following scenario: Two companies: Joe’s Coffee Shop and Starbucks both walk into a bank. Both would like to apply for the exact same loan. If I’m the bank owner, which company gets the lower interest rate on their loan? Starbucks of course! They have a longstanding business model with worldwide distribution and tremendous brand recognition. Joe’s Coffee Shop is a small, one-man operation that nobody’s ever heard of outside of a five mile radius. Reward for Risk It’s riskier to invest in the smaller company therefore; the bank should require a higher interest rate on the loan to Joe’s Coffee Shop. Investors have to be compensated for taking on the risk of investing in small companies versus big companies. Historically, the collective group of small company stocks has outperformed the collective group of large company stocks. They should. After all, they’re riskier. Exposure to value stocks: Regardless of the actual size of the company, what about the perceived value of the company? On one end of the spectrum there are “growth companies,” loosely defined as firms whose earnings have grown faster than other’s and are expected to continue to do so. On the other end lies “value companies,” often represented as depressed or out-of-favor businesses whose price is low relative to the company’s actual net worth. Because these value companies have a depressed price, they exhibit higher levels of risk for most investors. This uncertainty requires compensation. As a whole, the collective group of what are deemed value companies has historically outperformed the group of growth companies. They should. After all, they’re riskier. But diversification is still important! A diversified investment portfolio can eliminate the risk of any one particular company, country, sector or asset class from tanking an investor’s portfolio. There’s no such thing as a riskless stock or even a riskless investment. However, markets have historically rewarded different types of risk and therefore, risk helps to explain expected return. How Returns and Information Are Linked The search for expected return is the search for information itself. Unfortunately, not all leads are credible. The financial industry regularly rushes products to market citing new research without thoroughly understanding its validity. The research I’ve mentioned has been published for decades and has multiple Nobel Prize winners attached to it. Contrary to popular belief, there are very few “eureka” moments in the search for expected return. Today’s research more often than not stands on the shoulders of yesterday, building upon itself with incremental adjustments. For this reason, I generally recommend a healthy level of skepticism when the next big investment idea comes along. There’s a good chance it’s the same stuff we already know about just repackaged with attractive marketing. WealthShape’s pledge is we don’t believe anything until it is thoroughly tested in a lot of differed ways. That means weeding through all the research and then the massive number of funds claiming to apply the research to find optimal portfolio solutions.
University of Chicago Booth Professor and Nobel prize winning economist Eugene Fama talks about the evolution of modern finance.
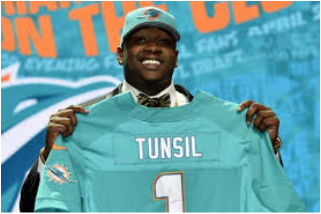
 In the span of roughly 20 minutes the highly rated Mississippi offensive tackle, Laremy Tunsil dropped about 10 spots to the number 13 pick in the NFL draft. Moments before the draft began a video of Tunsil smoking an unknown substance from a bong surfaced on his twitter account. The tweet was deleted just minutes after posting but the damage was done. Some analysts estimate the incident may have cost him in the neighborhood of 7 million dollars in salary. However, there was more on display here than costly twitter images. What the draft also demonstrated, was the speed at which information travels, and the subsequent market re-pricing based on new developments. In essence, Tunsil’s draft stock went from an exceptional, can’t miss growth prospect to distressed undervalued gamble. In the weeks and months leading up to the draft, teams scrutinize over the most trivial details surrounding the athletic abilities, physical features and personal lives of potential draftees. 32 NFL franchises set the market for the 253 draft slots. Each team has its own unique set of needs with only a small talent pool to choose from. The consequences for missing with a boom or bust prospect are severe; often costing head coaches their jobs. Run-ins with the law, knee injuries and work ethic all represent elements of risk. While Laremy Tunsil began the draft as an asset many were willing to sacrifice a costly number one pick for, he quickly became a discounted value choice for the eager Miami Dolphins, who never expected him to be around by the 13th pick. On the field few questioned his athletic ability. As a three-year starter in college football’s toughest conference, he kept some of the nations best pass rushers at bay with his size and agility. Teams pay more for players with strong track records due to the expectations that consistent earnings, in the form of on field success, will persist. With Tunsil, the price teams were willing to pay changed in an instant because suddenly he became a heck of lot riskier. Time will tell is his transgressions were momentary lapses in judgment or demonstrations of deep seeded character flaws. In 3 years we’ll know if the 12 teams that passed on him dodged a bullet, or if the Dolphins landed a their next Pro Bowl player at a tremendous value. |
By Tim Baker, CFP®Advice and investment design should rely on long term, proven evidence. This column is dedicated to helping investors across the country, from all walks of life to understand the benefits of disciplined investing and the importance of planning. Archives
December 2023
|
|
Phone: 860-837-0303
|
Message: [email protected]
|
|
WINDSOR
360 Bloomfield Ave 3rd Floor Windsor, CT 06095 |
WEST HARTFORD
15 N Main St #100 West Hartford, CT 06107 |
SHELTON
One Reservoir Corporate Centre 4 Research Dr - Suite 402 Shelton, CT 06484 |
ROCKY HILL
175 Capital Boulevard 4th Floor Rocky Hill, CT 06067 |
Home I Who We Are I How We Invest I Portfolios I Financial Planning I Financial Tools I Wealth Management I Retirement Plan Services I Blog I Contact I FAQ I Log In I Privacy Policy I Regulatory & Disclosures
© 2024 WealthShape. All rights reserved.


