|
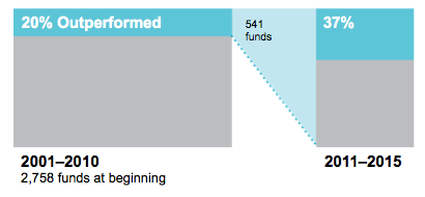
Virtually every investment disclosure includes some variation of the following statement: “past performance is no guarantee of future results.” Very few investors pay any attention to those words, but more should. Not only because they give further information about the data that’s being presented, but also because of the reason these statements are included. Is evaluating past performance the best way to select mutual funds? Do Outperforming US Equity Mutual Funds persist? The research offers strong evidence to the contrary. This chart illustrates the lack of persistence in outperformance among US equity mutual funds. The funds are evaluated based on their 10-year track records (2001-2010), and those that beat their respective benchmarks are re-evaluated in the subsequent five-year period (2011-2015). Among the 2,758 equity funds that began the initial 10-year period, only 20% outperformed—and among these 541 winning funds, only 37% continued to beat their benchmarks in the subsequent five-year period. Some US equity fund managers may be better than others, but this evidence shows the extreme difficulties in identifying them in advance using track records alone. Returns contain a lot of noise, and impressive track records often result from good luck. The assumption that past outperformance will continue often proves faulty and leaves many investors disappointed. Investment evaluation should embrace a variety of additional metrics including but not limited to the funds strategy: taking into account empirical rationale and economic intuition, cost, style drift and of course overall risk. It’s also critical that any evaluation take into consideration how your overall portfolio is impacted by the addition or subtraction of a fund. The graph shows the proportion of US equity mutual funds that outperformed and underperformed their respective benchmarks (i.e., winners and losers) during the initial 10-year period ending December 31, 2010. Winning funds were re-evaluated in the subsequent five-year period from 2011 through 2015, with the graph showing winners (outperformers) and losers (underperformers). Fund count and percentages may not correspond due to rounding. Past performance is no guarantee of future results. Data Source: Analysis conducted by Dimensional Fund Advisors using data on US-domiciled mutual funds obtained from the CRSP Survivor-Bias-Free US Mutual Fund Database, provided by the Center for Research in Security Prices, University of Chicago. Sample excludes index funds. Benchmark data provided by MSCI, Russell, and S&P. MSCI data © MSCI 2016, all rights reserved. Russell data © Russell Investment Group 1995-2016, all rights reserved. The S&P data are provided by Standard & Poor’s Index Services Group. Benchmark indices are not available for direct investment. Their performance does not reflect the expenses associated with the management of an actual portfolio. Mutual fund investment values will fluctuate, and shares, when redeemed, may be worth more or less than their original cost. Diversification neither assures a profit nor guarantees against a loss in a declining market.
Comments are closed.
|
By Tim Baker, CFP®Advice and investment design should rely on long term, proven evidence. This column is dedicated to helping investors across the country, from all walks of life to understand the benefits of disciplined investing and the importance of planning. Archives
December 2023
|
|
Phone: 860-837-0303
|
Message: [email protected]
|
|
WINDSOR
360 Bloomfield Ave 3rd Floor Windsor, CT 06095 |
WEST HARTFORD
15 N Main St #100 West Hartford, CT 06107 |
SHELTON
One Reservoir Corporate Centre 4 Research Dr - Suite 402 Shelton, CT 06484 |
ROCKY HILL
175 Capital Boulevard 4th Floor Rocky Hill, CT 06067 |
Home I Who We Are I How We Invest I Portfolios I Financial Planning I Financial Tools I Wealth Management I Retirement Plan Services I Blog I Contact I FAQ I Log In I Privacy Policy I Regulatory & Disclosures
© 2024 WealthShape. All rights reserved.


