|
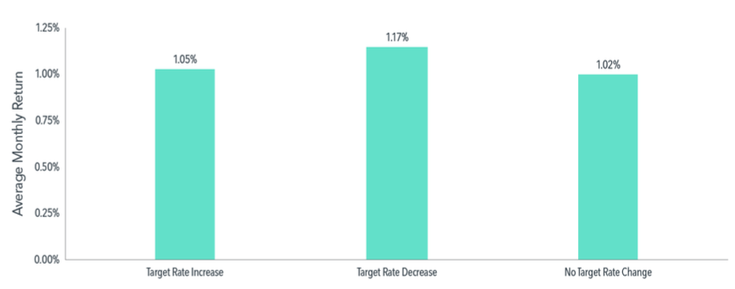
On May 4, the US Federal Reserve increased the target federal funds rate1 by 50 basis points as part of what the central bank said will be a series of rate increases to combat soaring inflation in the US. Some investors may worry that rising interest rates will decrease equity valuations and therefore lead to relatively poor equity market performance. However, history offers good news: Equity returns in the US have been positive on average following hikes in the fed funds rate. We study the relation between US equity returns, measured by the Fama/French Total US Market Research Index, and changes in the federal funds target rate from 1983 to 2021. Over this period of 468 months, rates increased in 70 months and decreased in 67 months. Exhibit 1 presents the average monthly returns of US equities in months when there is an increase, decrease, or no change in the target rate. On average, US equity market returns are reliably positive in months with increases in target rates.2 Moreover, the average stock market return in those months is similar to the average return in months with decreases or no changes in target rates. EXHIBIT 1 Reliably Rewarding US equity market returns and fed funds target rate change, January 1983–December 2021 What about the months after rate hikes? This question may be of particular interest when the Fed is expected to increase the federal funds target rate multiple times. Exhibit 2 presents annualized US equity market returns over the one-, three-, and five-year periods following one or two consecutive monthly increases in the fed funds target rate, as well as following months with no increase. In reassuring news for investors concerned with the current environment of increasing rates, the US equity market has delivered strong longer-term performance on average regardless of activity at the Fed. EXHIBIT 2 Keep On Keeping On US equity market returns following consecutive fed funds rate hikes, January 1983–December 2021 With a number of Federal Open Market Committee meetings remaining in 2022, the Fed’s signals and actions will continue to be closely watched by the market. As the Fed often signals its agenda in advance, we believe market participants are already incorporating this information into market prices. While it’s natural to wonder what the Fed’s actions mean for equity performance, our research indicates that US equity markets offer positive returns on average following rate hikes. Thus, reducing equity allocations in anticipation of, or in reaction to, fed funds rate increases is unlikely to lead to better investment outcomes. Instead, investors who maintain a broadly diversified portfolio and use information in market prices to systematically focus on higher expected returns may be better positioned for long-term investment success. GLOSSARY
Basis point: One basis point (bps) equals 0.01%. FOOTNOTES 1. The federal funds rate is the interest rate at which depository institutions lend balances at the US Federal Reserve to other depository institutions overnight. 2. The Federal Open Market Committee (FOMC) holds eight regularly scheduled meetings per year and may not change the target rate at every meeting. The FOMC may also change the target rate multiple times within the same month; in such instances, we aggregate all changes by month. Past performance is not a guarantee of future results. Exhibit 1: Source: Monthly target federal funds rate data from Federal Reserve Bank of St. Louis. The monthly series reflects the federal funds target rate from January 1983 through December 2008 and the federal funds target range—upper limit (ul) from January 2009 through December 2021. Equity market returns computed using monthly return of the Fama/French Total US Market Research Index, available from Ken French Data Library. There are 70 months with a rate increase, 67 months with a rate decrease, and 331 months with no change. Exhibit 2: Source: Monthly target federal funds rate data from Federal Reserve Bank of St. Louis. The monthly series reflects the federal funds target rate from January 1983 through December 2008 and the federal funds target range—upper limit (ul) from January 2009 through December 2021. Equity market returns computed using monthly return to the Fama/French Total US Market Research Index, available from Ken French Data Library. There are 70 one-month rate hikes, 28 two- month rate hikes, and 389 months without an increase. Average annualized returns following consecutive rate increases starting at month end; performance time horizons can overlap. Eugene Fama and Ken French are members of the Board of Directors of the general partner of, and provide consulting services to, Dimensional Fund Advisors LP. This information is intended for educational purposes and should not be considered a recommendation to buy or sell a particular security. Dimensional Fund Advisors LP is an investment advisor registered with the Securities and Exchange Commission. Comments are closed.
|
By Tim Baker, CFP®Advice and investment design should rely on long term, proven evidence. This column is dedicated to helping investors across the country, from all walks of life to understand the benefits of disciplined investing and the importance of planning. Archives
December 2023
|
|
Phone: 860-837-0303
|
Message: [email protected]
|
|
WINDSOR
360 Bloomfield Ave 3rd Floor Windsor, CT 06095 |
WEST HARTFORD
15 N Main St #100 West Hartford, CT 06107 |
SHELTON
One Reservoir Corporate Centre 4 Research Dr - Suite 402 Shelton, CT 06484 |
ROCKY HILL
175 Capital Boulevard 4th Floor Rocky Hill, CT 06067 |
Home I Who We Are I How We Invest I Portfolios I Financial Planning I Financial Tools I Wealth Management I Retirement Plan Services I Blog I Contact I FAQ I Log In I Privacy Policy I Regulatory & Disclosures
© 2024 WealthShape. All rights reserved.


