|
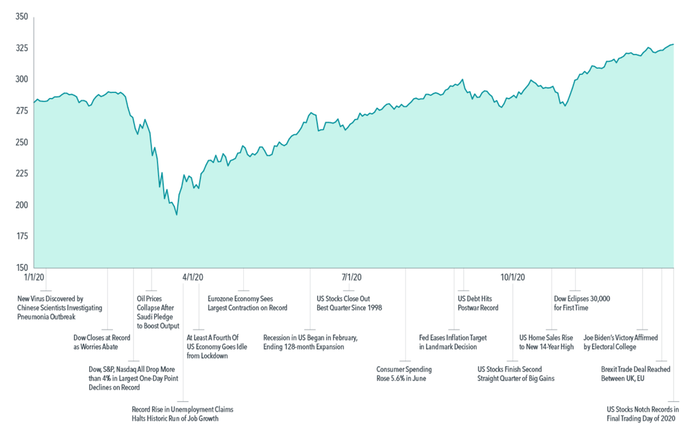
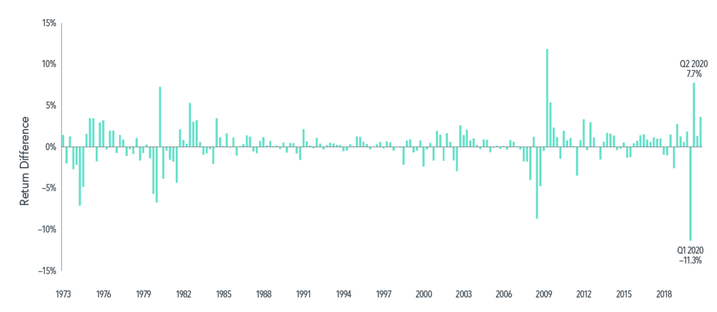
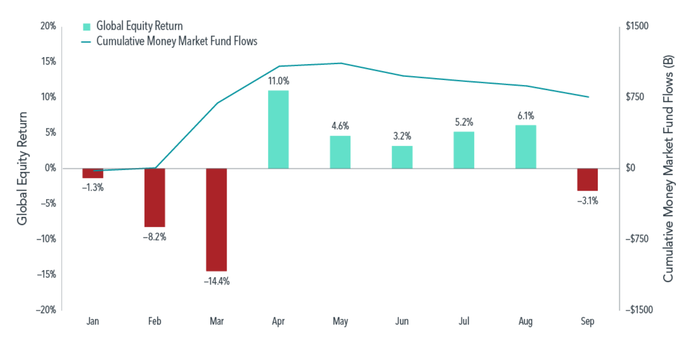
The year 2020 proved to be one of the most tumultuous in modern history, marked by a number of developments that were historically unprecedented. But the year also demonstrated the resilience of people, institutions, and financial markets. The novel coronavirus was already in the news early in the year, and concerns grew as more countries began reporting their first cases of COVID-19. Infections multiplied around the world through February, and by early March, when the outbreak was labeled a pandemic, it was clear that the crisis would affect nearly every area of our lives. The spring would see a spike in cases and a global economic contraction as people stayed closer to home, and another surge of infections would come during the summer. Governments and central banks worked to cushion the blow, providing financial support for individuals and businesses and adjusting lending rates. On top of the health crisis, there was widespread civil unrest over the summer in the US tied to policing and racial justice. In August, Americans increasingly focused on the US presidential race in this unusual year. Politicians, supporters, and voting officials wrestled with the challenges of a campaign that at times was conducted virtually and with an election in the fall that would include a heightened level of mail-in and early voting. In the end, the results of the election would be disputed well into December. As autumn turned to winter, 2020 would end with both troubling and hopeful news: yet another spike in COVID-19 cases, along with the first deliveries of vaccines in the US and elsewhere. For investors, the year was characterized by sharp swings for stocks. March saw a 33.79% drop in the S&P 500 Index1 as the pandemic worsened. This was followed by a rally in April, and stocks reached their previous highs by August. Ultimately, despite a sequence of epic events and continued concerns over the pandemic, global stock market returns in 2020 were above their historical norm. The US market finished the year in record territory and with an 18.40% annual return for the S&P 500 Index. Non-US developed markets, as measured by the MSCI World ex USA Index,2 returned 7.59%. Emerging markets, as measured by the MSCI Emerging Markets Index, returned 18.31% for the year. Exhibit 1: Highs and Lows MSCI All Country World Index with selected headlines from 2020 Fixed income markets mirrored the extremity of equity behavior, with nearly unprecedented dispersion in returns during the first half of 2020. For example, in the first quarter, US corporate bonds underperformed US Treasuries by more than 11%, the most negative quarterly return difference in data going back a half century. But they soon swapped places: the second quarter was the second-most positive one on record for corporates over Treasuries, with a 7.74% advantage.3 Large return deviations were also observed between US and non-US fixed income as well as between inflation-protected and nominal bonds. Global yield curves finished the year generally lower than at the start. US Treasury yields, for example, fell across the board, with drops of more than 1% on the short and intermediate portions of the curve.4 The US Treasury curve ended relatively flat in the short-term segment but upwardly sloped from the intermediate- to long-term segment. For 2020, the Bloomberg Barclays Global Aggregate Bond Index5 returned 5.58%. Exhibit 2: Sharp Shifts US Credit minus US Treasury: Quarterly Returns, March 1973– December 2020 Uncertainty remains about the pandemic and the broad impact of the new vaccines, continued lockdowns, and social distancing. But the events of 2020 provided investors with many lessons, affirming that following a disciplined and broadly diversified investment approach is a reliable way to pursue long-term investment goals. MARKET PRICES QUICKLY REFLECT NEW INFORMATION ABOUT THE FUTURE The fluctuating markets in the spring and summer were also a lesson in how markets incorporate new information and changes in expectations. From its peak on February 19, 2020, the S&P 500 Index fell 33.79% in less than five weeks as the news headlines suggested more extreme outcomes from the pandemic. But the recovery would be swift as well. Market participants were watching for news that would provide insights into the pandemic and the economy, such as daily infection and mortality rates, effective therapeutic treatments, and the potential for vaccine development. As more information became available, the S&P 500 Index jumped 17.57% from its March 23 low in just three trading sessions, one of the fastest snapbacks on record. This period highlighted the vital role of data in setting market expectations and underscored how quickly prices adjust to new information. One major theme of the year was the perceived disconnect between markets and the economy. How could the equity markets recover and reach new highs when the economic news remained so bleak? The market’s behavior suggests investors were looking past the short-term impact of the pandemic to assess the expected rebound of business activity and an eventual return to more-normal conditions. Seen through that lens, the rebound in share prices reflected a market that is always looking ahead, incorporating both current news and expectations of the future into stock prices. OWNING THE WINNERS AND LOSERS The 2020 economy and market also underscored the importance of staying broadly diversified across companies and industries. The downturn in stocks impacted some segments of the market more than others in ways that were consistent with the impact of the COVID-19 pandemic on certain types of businesses or industries. For example, airline, hospitality, and retail industries tended to suffer disproportionately with people around the world staying at home, whereas companies in communications, online shopping, and technology emerged as relative winners during the crisis. However, predicting at the beginning of 2020 exactly how this might play out would likely have proved challenging. In the end, the economic turmoil inflicted great hardship on some firms while creating economic and social conditions that provided growth opportunities for other companies. In any market, there will be winners and losers-and investors have historically been well served by owning a broad range of companies rather than trying to pick winners and losers. STICKING WITH YOUR PLAN Many news reports rightly emphasized the unprecedented nature of the health crisis, the emergency financial actions, and other extraordinary events during 2020. The year saw many “firsts”—and subsequent years will doubtless usher in many more. Yet 2020’s outcomes remind us that a consistent investment approach is a reliable path regardless of the market events we encounter. Investors who made moves by reacting to the moment may have missed opportunities. In March, spooked investors fled the stock and bond markets, as money-market funds experienced net flows for the month totaling $684 billion. Then, over the six-month period from April 1 to September 30, global equities and fixed income returned 29.54% and 3.16%, respectively. A move to cash in March may have been a costly decision for anxious investors. Exhibit 3: Cash Concerns in 2020 It was important for investors to avoid reacting to the dispersion in performance between asset classes, too, lest they miss out on turnarounds from early in the year to later. For example, small cap stocks on the whole fared better in the second half of the year than the first. The stark difference in performance between the first and second quarters across bond classes also drives home this point. A WELCOME TURN OF THE CALENDAR Moving into 2021, many questions remain about the pandemic, new vaccines, business activity, changes in how people work and socialize, and the direction of global markets. Yet 2020’s economic and market tumult demonstrated that markets continue to function and that people can adapt to difficult circumstances. The year’s positive equity and fixed income returns remind that, with a solid investment approach and a commitment to staying the course, investors can focus on building long-term wealth, even in challenging times. All data is from sources believed to be reliable but cannot be guaranteed or warranted. This information is intended for educational purposes, and it is not to be construed as an offer, solicitation, recommendation, or endorsement of any particular security, products, or services. No one should assume that any discussion or information contained in this material serves as a receipt of, or as a substitute for, personalized investment, tax or legal advice. Diversification does not eliminate the risk of market loss. Investment risks include loss of principal and fluctuating value. Past performance is not a guarantee of future results. Indices are not available for direct investment; therefore, their performance does not reflect the expenses associated with the management of an actual portfolio.
Appendix Looking Back on an Unprecedented Year Past performance is no guarantee of future results. Exhibit 1: In US dollars, net dividends. MSCI data © MSCI 2021, all rights reserved. Indices are not available for direct investment. Index returns are not representative of actual portfolios and do not reflect costs and fees associated with an actual investment. Exhibit 2: In US dollars. US credit represented by the Bloomberg Barclays US Credit Bond Index. US Treasuries represented by the Bloomberg Barclays US Treasury Bond Index. Bloomberg Barclays data provided by Bloomberg. Indices are not available for direct investment. Index returns are not representative of actual portfolios and do not reflect costs and fees associated with an actual investment. Exhibit 3: In US dollars. Global equity returns is the MSCI All Country World IMI Index (net div.). MSCI data © MSCI 2021, all rights reserved. Money market fund flows provided by Morningstar. Indices are not available for direct investment. Index returns are not representative of actual portfolios and do not reflect costs and fees associated with an actual investment. 1. S&P data © 2021 S&P Dow Jones Indices LLC, a division of S&P Global. All rights reserved. Indices are not available for direct investment. 2. MSCI data © MSCI 2021, all rights reserved. Indices are not available for direct investment. 3. US corporate bonds represented by the Bloomberg Barclays US Credit Bond Index. US Treasuries represented by the Bloomberg Barclays US Treasury Bond Index. Bloomberg Barclays data provided by Bloomberg. Indices are not available for direct investment. 4. ICE BofA government yield. ICE BofA index data © 2021 ICE Data Indices, LLC. 5. Bloomberg Barclays data provided by Bloomberg. All rights reserved. Indices are not available for direct investment. The information in this material is intended for the recipient’s background information and use only. It is provided in good faith and without any warranty or, representation as to accuracy or completeness. Information and opinions presented in this material have been obtained or derived from sources believed by the Issuing Entity to be reliable and the Issuing Entity has reasonable grounds to believe that all factual information herein is true as at the date of this document. It does not constitute investment advice, recommendation, or an offer of any services or products for sale and is not intended to provide a sufficient basis on which to make an investment decision. It is the responsibility of any persons wishing to make a purchase to inform themselves of and observe all applicable laws and regulations. Unauthorised reproduction or transmitting of this material is strictly prohibited. The Issuing Entity does not accept responsibility for loss arising from the use of the information contained herein. Comments are closed.
|
By Tim Baker, CFP®Advice and investment design should rely on long term, proven evidence. This column is dedicated to helping investors across the country, from all walks of life to understand the benefits of disciplined investing and the importance of planning. Archives
December 2023
|
|
Phone: 860-837-0303
|
Message: [email protected]
|
|
WINDSOR
360 Bloomfield Ave 3rd Floor Windsor, CT 06095 |
WEST HARTFORD
15 N Main St #100 West Hartford, CT 06107 |
SHELTON
One Reservoir Corporate Centre 4 Research Dr - Suite 402 Shelton, CT 06484 |
ROCKY HILL
175 Capital Boulevard 4th Floor Rocky Hill, CT 06067 |
Home I Who We Are I How We Invest I Portfolios I Financial Planning I Financial Tools I Wealth Management I Retirement Plan Services I Blog I Contact I FAQ I Log In I Privacy Policy I Regulatory & Disclosures
© 2024 WealthShape. All rights reserved.


