|
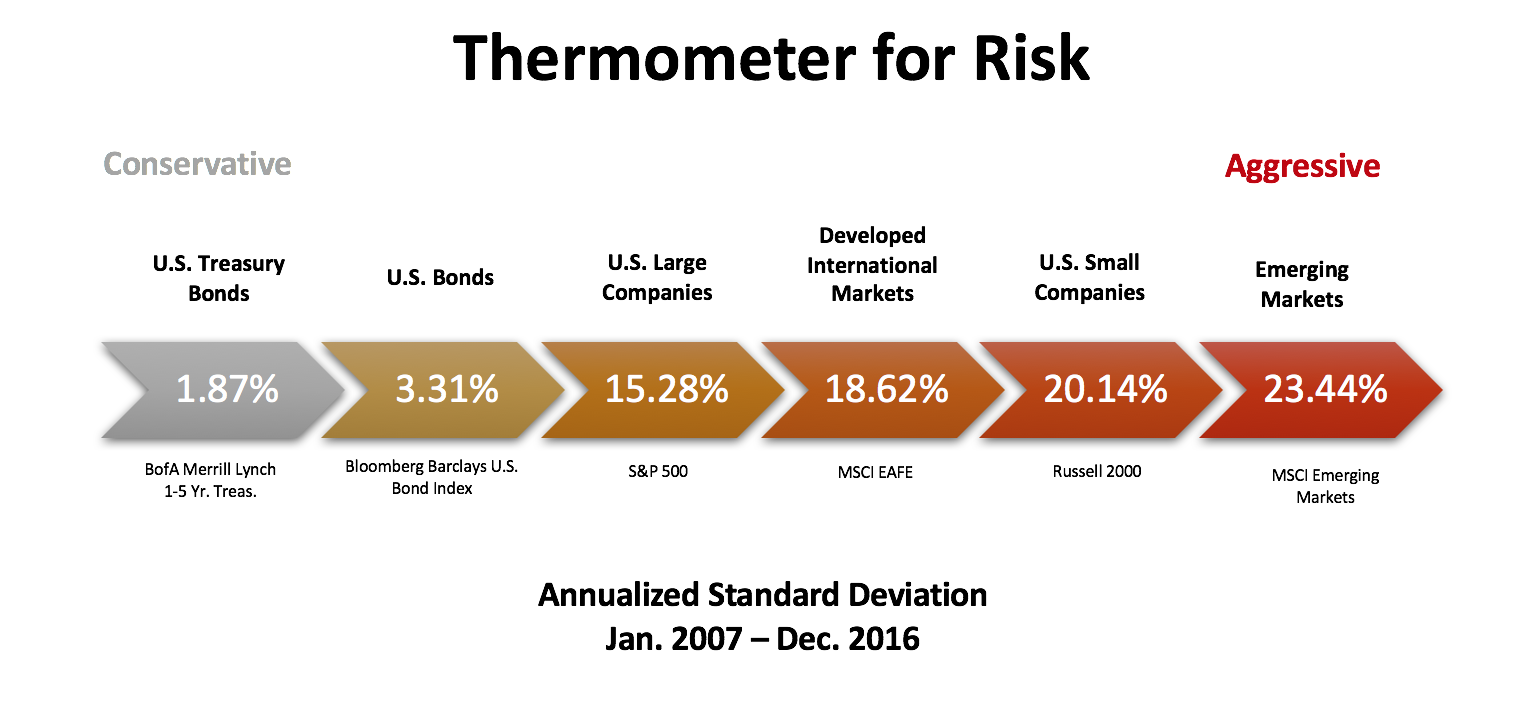
It’s been said that risk and reward is a double edged sword, inseparable and ever present in all aspects of life. We make daily decisions with our health, relationships, time etc. that in some way demonstrate a tradeoff between risk and reward. In essence, these decisions while seemingly trivial at times are mental calculations that attach probabilities depending on the gravity of each situation. So, how do we calculate the inherent relationship between risk and reward in our portfolio’s? I won’t be the first to tell you that financial jargon is dull to most people, but this term’s impact shouldn’t be. It’s called “standard deviation” and few investors have a clue what it means to their portfolio. First, higher isn’t always better. Double digit returns feel great. For risk averse investors, double digit standard deviation does not! As a historic volatility measurement, think of standard deviation as a thermometer for risk, or better yet anxiety. The higher it goes, the higher your blood pressure rises during volatile times. Portfolios that report large standard deviation numbers have experienced wide fluctuations in returns, both positively and negatively, around the average return. Those with a lower standard deviation have been able to mitigate volatility, meaning the up and down swings of the returns aren’t as wide. How it works in practical application
For this example, we’ll use 2x standard deviation. All that means, is we’ll be multiplying the standard deviation by 2 (known as the 95% confidence interval, which basically says that 95% of the time we can expect the return to lie between these two numbers in any given year). From the beginning of 2007 to the end of 2016 the S&P 500 average annual return was 6.95%. The standard deviation was 15.28%. Simplifying the numbers: 15 times 2 = 30. Now we just add 30 to the 6.95% average return to get 36.95% and subtract 30 from 6.95% to get -23.05%. In summation, with 95% confidence we can expect the S&P 500 return to fall between +36.95% and -23.05% in any given year based on historic volatility over the last ten years. Typically, as exposure to assets that tend to fluctuate more (i.e. stocks) increases, so does standard deviation. Therefore, if well diversified, a 100% stock portfolio will likely have higher historic volatility than 80% stocks, 80% higher than 60% stocks and so on. However, it doesn’t stop at the portfolio level. The underlying funds that make up your portfolio also exhibit volatility characteristics based on their makeup, sort of like a portfolio within your portfolio. For instance, you should generally expect an emerging markets fund to have a higher standard deviation than a US large cap growth fund because of the historically high volatility associated with emerging markets as an asset class. Why is that important? All else being equal, two portfolios that appear similar from a general stock to bond ratio will likely have vastly different experiences if one has 20% more exposure to emerging markets than the other. Returns should always be discussed in context with the level of risk it took to achieve them. When it comes to measuring volatility, the more years of data the better. Standard deviation shouldn’t be measured over a period of less than 3 years with a preference being the inception date of the portfolio or fund. The concept of risk and reward is ever-present in our daily lives. Understanding the true level of risk in our portfolios only serves to reinforce expectations and strengthen the discipline of long term investors Comments are closed.
|
By Tim Baker, CFP®Advice and investment design should rely on long term, proven evidence. This column is dedicated to helping investors across the country, from all walks of life to understand the benefits of disciplined investing and the importance of planning. Archives
December 2023
|
|
Phone: 860-837-0303
|
Message: [email protected]
|
|
WINDSOR
360 Bloomfield Ave 3rd Floor Windsor, CT 06095 |
WEST HARTFORD
15 N Main St #100 West Hartford, CT 06107 |
SHELTON
One Reservoir Corporate Centre 4 Research Dr - Suite 402 Shelton, CT 06484 |
ROCKY HILL
175 Capital Boulevard 4th Floor Rocky Hill, CT 06067 |
Home I Who We Are I How We Invest I Portfolios I Financial Planning I Financial Tools I Wealth Management I Retirement Plan Services I Blog I Contact I FAQ I Log In I Privacy Policy I Regulatory & Disclosures
© 2024 WealthShape. All rights reserved.


