
|
Should stock investors worry about changes in interest rates? Research shows that, like stock prices, changes in interest rates and bond prices are largely unpredictable.[1] It follows that an investment strategy based upon attempting to exploit these sorts of changes isn’t likely to be a fruitful endeavor. Despite the unpredictable nature of interest rate changes, investors may still be curious about what might happen to stocks if interest rates go up. Unlike bond prices, which tend to go down when yields go up, stock prices might rise or fall with changes in interest rates. For stocks, it can go either way because a stock’s price depends on both future cash flows to investors and the discount rate they apply to those expected cash flows. When interest rates rise, the discount rate may increase, which in turn could cause the price of the stock to fall. However, it is also possible that when interest rates change, expectations about future cash flows expected from holding a stock also change. So, if theory doesn’t tell us what the overall effect should be, the next question is what does the data say? Recent Research Recent research performed by Dimensional Fund Advisors helps provide insight into this question.[2] The research examines the correlation between monthly US stock returns and changes in interest rates.[3] Exhibit 1 shows that while there is a lot of noise in stock returns and no clear pattern, not much of that variation appears to be related to changes in the effective federal funds rate.[4] Exhibit 1. Monthly US Stock Returns against Monthly Changes in Effective Federal Funds Rate, August 1954–December 2016 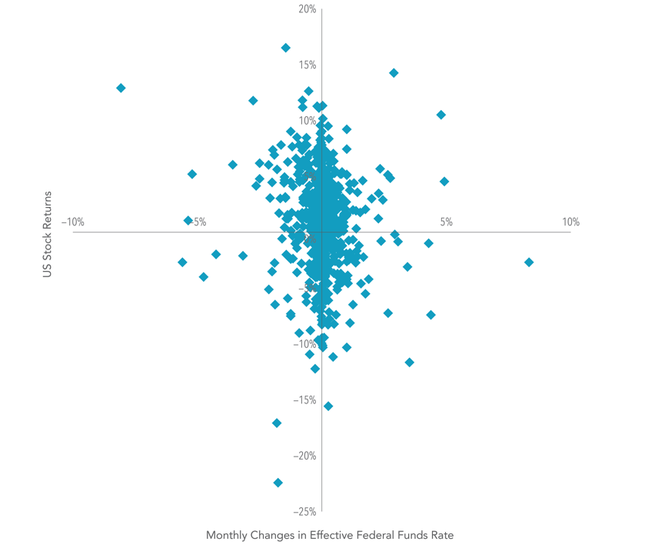 Monthly US stock returns are defined as the monthly return of the Fama/French Total US Market Index and are compared to contemporaneous monthly changes in the effective federal funds rate. Bond yield changes are obtained from the Federal Reserve Bank of St. Louis. For example, in months when the federal funds rate rose, stock returns were as low as –15.56% and as high as 14.27%. In months when rates fell, returns ranged from –22.41% to 16.52%. Given that there are many other interest rates besides just the federal funds rate, Dai also examined longer-term interest rates and found similar results. So to address our initial question: when rates go up, do stock prices go down? The answer is yes, but only about 40% of the time. In the remaining 60% of months, stock returns were positive. This split between positive and negative returns was about the same when examining all months, not just those in which rates went up. In other words, there is not a clear link between stock returns and interest rate changes. Conclusion There’s no evidence that investors can reliably predict changes in interest rates. Even with perfect knowledge of what will happen with future interest rate changes, this information provides little guidance about subsequent stock returns. Instead, staying invested and avoiding the temptation to make changes based on short-term predictions may increase the likelihood of consistently capturing what the stock market has to offer. Glossary
Discount Rate: Also known as the “required rate of return,” this is the expected return investors demand for holding a stock. Correlation: A statistical measure that indicates the extent to which two variables are related or move together. Correlation is positive when two variables tend to move in the same direction and negative when they tend to move in opposite directions. Index Descriptions Fama/French Total US Market Index: Provided by Fama/French from CRSP securities data. Includes all US operating companies trading on the NYSE, AMEX, or Nasdaq NMS. Excludes ADRs, investment companies, tracking stocks, non-US incorporated companies, closed-end funds, certificates, shares of beneficial interests, and Berkshire Hathaway Inc. (Permco 540). Source: Dimensional Fund Advisors LP. Results shown during periods prior to each Index’s index inception date do not represent actual returns of the respective index. Other periods selected may have different results, including losses. Backtested index performance is hypothetical and is provided for informational purposes only to indicate historical performance had the index been calculated over the relevant time periods. Backtested performance results assume the reinvestment of dividends and capital gains. Eugene Fama and Ken French are members of the Board of Directors for and provide consulting services to Dimensional Fund Advisors LP. There is no guarantee investment strategies will be successful. Investing involves risks including possible loss of principal. All expressions of opinion are subject to change. This article is distributed for informational purposes, and it is not to be construed as an offer, solicitation, recommendation, or endorsement of any particular security, products, or services. [1]. See, for example, Fama 1976, Fama 1984, Fama and Bliss 1987, Campbell and Shiller 1991, and Duffee 2002. [2]. Wei Dai, “Interest Rates and Equity Returns” (Dimensional Fund Advisors, April 2017). [3]. US stock market defined as Fama/French Total US Market Index. [4]. The federal funds rate is the interest rate at which depository institutions lend funds maintained at the Federal Reserve to another depository institution overnight. Comments are closed.
|
|
Phone: 860-837-0303
|
Message: [email protected]
|
|
WINDSOR
360 Bloomfield Ave 3rd Floor Windsor, CT 06095 |
WEST HARTFORD
15 N Main St #100 West Hartford, CT 06107 |
SHELTON
One Reservoir Corporate Centre 4 Research Dr - Suite 402 Shelton, CT 06484 |
ROCKY HILL
175 Capital Boulevard 4th Floor Rocky Hill, CT 06067 |
Home I Who We Are I How We Invest I Portfolios I Financial Planning I Financial Tools I Wealth Management I Retirement Plan Services I Blog I Contact I FAQ I Log In I Privacy Policy I Regulatory & Disclosures

|

|

|
|

|

|

|
© 2024 WealthShape. All rights reserved.