
|
The Magnificent 7 stocks continue to capture the focus of investors as these large growth names have outpaced the bulk of global equities. Their outperformance is notable because eye-popping returns for top stocks tend to occur before they reach the top of the market. Once there, subsequent returns tend to lag the market. EXHIBIT 1 View from the Top Annualized returns in excess of the US market before and after joining the top 10 largest US stocks, January 1927–December 2022 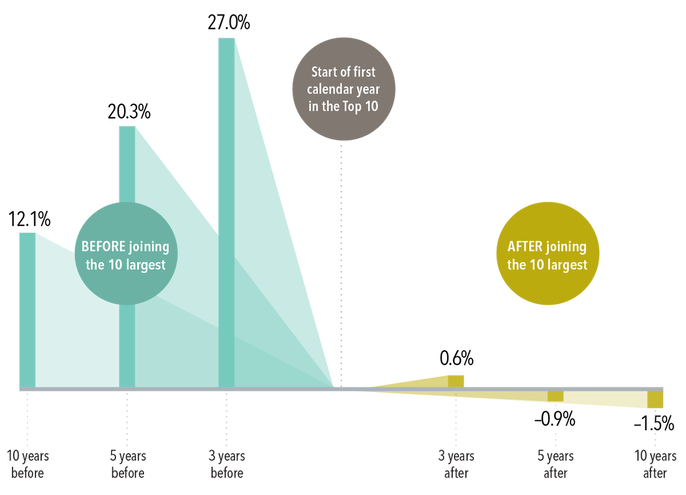 This is a cautionary tale for investors expecting continued outperformance from the Magnificent 7. In fact, rather than seeking additional exposure to these mega cap stocks, investors should ensure their portfolios are broadly diversified to capture the returns of whatever companies ascend to the top in the future. Past performance is not a guarantee of future results. In USD. Data from CRSP and Compustat. Companies are sorted every January by beginning-of-month market capitalization to identify first-time entrants into the top 10. The market is defined as the Fama/French Total US Market Research Index. The Fama/French indices represent academic concepts that may be used in portfolio construction and are not available for direct investment or for use as a benchmark. Eugene Fama and Ken French are members of the Board of Directors of the general partner of, and provide consulting services to, Dimensional Fund Advisors LP. See “Index Description” for a description of the Fama/French index data.
Indices are not available for direct investment. The index has been included for comparative purposes only. FOOTNOTES 1The Magnificent 7 stocks include Alphabet, Amazon, Apple, Meta Platforms, Microsoft, NVIDIA, and Tesla. Named securities may be held in accounts managed by Dimensional. DISCLOSURES The information in this material is intended for the recipient’s background information and use only. It is provided in good faith and without any warranty or representation as to accuracy or completeness. RISKS Investments involve risks. The investment return and principal value of an investment may fluctuate so that an investor’s shares, when redeemed, may be worth more or less than their original value. Past performance is not a guarantee of future results. There is no guarantee strategies will be successful. Investment opportunities exist all around the globe, but the randomness of global stock returns makes it exceedingly difficult to figure out which markets are likely to be outperformers. How should investors deal with this kind of uncertainty? First, they should remember that it’s challenging, at best, to predict a country’s returns by looking at the past, as shown by the performance of global markets since 2001 (see Exhibit 1). In the past 20 years, annual returns in 22 developed markets varied widely from year to year. (Each color represents a different country, and each column is sorted top down, from the highest-performing country to the lowest.) EXHIBIT 1 Most Favored Nations 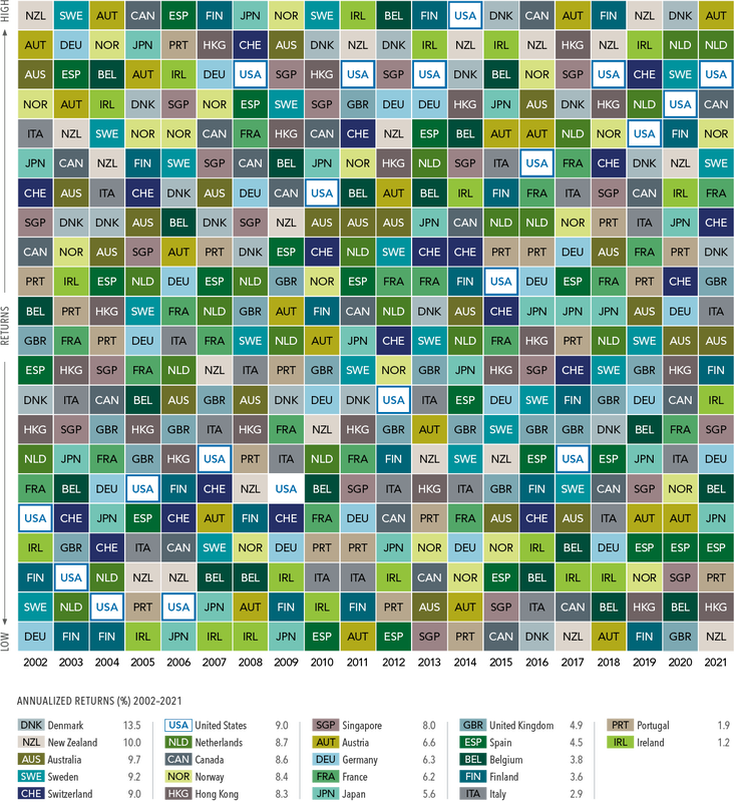 Past performance is no guarantee of results. In USD. MSCI country indices (net dividends) for each country listed. Does not include Israel, which MSCI classified as an emerging market prior to May 2010. MSCI data © MSCI 2021, all rights reserved. Two examples help make the point well:
Investors can benefit from understanding that they don’t need to predict which countries will deliver the best returns during the next quarter, next year, or next five years. Why? Holding equities from markets around the world—as opposed to those of a few countries or just one—positions investors to potentially capture higher returns where they appear, and outperformance in one market can help offset lower returns elsewhere. Put another way, a globally diversified portfolio can help provide more reliable outcomes over time. DISCLOSURES
The information in this material is intended for the recipient’s background information and use only. It is provided in good faith and without any warranty or representation as to accuracy or completeness. Information and opinions presented in this material have been obtained or derived from sources believed by Dimensional to be reliable, and Dimensional has reasonable grounds to believe that all factual information herein is true as at the date of this material. It does not constitute investment advice, a recommendation, or an offer of any services or products for sale and is not intended to provide a sufficient basis on which to make an investment decision. Before acting on any information in this document, you should consider whether it is appropriate for your particular circumstances and, if appropriate, seek professional advice. It is the responsibility of any persons wishing to make a purchase to inform themselves of and observe all applicable laws and regulations. Unauthorized reproduction or transmission of this material is strictly prohibited. Dimensional accepts no responsibility for loss arising from the use of the information contained herein. This material is not directed at any person in any jurisdiction where the availability of this material is prohibited or would subject Dimensional or its products or services to any registration, licensing, or other such legal requirements within the jurisdiction. “Dimensional” refers to the Dimensional separate but affiliated entities generally, rather than to one particular entity. These entities are Dimensional Fund Advisors LP, Dimensional Fund Advisors Ltd., Dimensional Ireland Limited, DFA Australia Limited, Dimensional Fund Advisors Canada ULC, Dimensional Fund Advisors Pte. Ltd., Dimensional Japan Ltd. and Dimensional Hong Kong Limited. Dimensional Hong Kong Limited is licensed by the Securities and Futures Commission to conduct Type 1 (dealing in securities) regulated activities only and does not provide asset management services. RISKS Investments involve risks. The investment return and principal value of an investment may fluctuate so that an investor’s shares, when redeemed, may be worth more or less than their original value. Past performance is not a guarantee of future results. There is no guarantee strategies will be successful. Diversification does not eliminate the risk of market loss.
Should you change your investments according to which party wins a majority on Capitol Hill? History shows that markets have rewarded investors, no matter who controls Congress.
Financial innovation provides investors with a seemingly endless supply of new investment options. But the process of evaluating the merits of these investments remains the same even as the names change. Adopting a new component in one’s asset allocation represents a tradeoff that should carefully balance the expected benefit vs. the cost of its inclusion. The following framework highlights benefits investors may seek as well as potential drawbacks—a checklist that applies to any investment opportunity. STARTING ON A ROLE Properly evaluating whether something belongs in your portfolio begins with specifying the role it is expected to play. These roles come down to a) increasing your expected return or b) helping manage risk. If the objective is to increase expected returns, what is the case for the asset in question accomplishing that? It is easy to link a positive expected return with equities, for example, as stock ownership gives you a claim on companies’ future cash flows. Similarly, bondholders expect to receive periodic interest payments and the return of their principal as stipulated in the bond’s covenant. But an asset that lacks a sound foundation for delivering a positive expected return should give investors pause, regardless of its past performance. Investors should also be wary of making assessments about expected returns in asset classes with limited data. Newer products with shorter track records give investors less information about what to expect in an asset class. Non-publicly traded investments may pose additional hurdles due to a lack of timely market-based performance data. And, finally, the age-old difficulty in distinguishing between luck and skill is amplified in more- volatile asset classes. Expected return may take a back seat in the case of an asset that helps manage risk. Professor Ken French defines risk as uncertainty about lifetime consumption. This uncertainty stems from many sources, including market downturns, inflation, and interest rate changes, to name a few. Risk- management assets should offer a robust way to mitigate the contributions from one or more of these contributors to uncertainty. Investors should avoid “missing the forest for the trees” when hedging risk. For example, an asset class whose returns are correlated with inflation but are much more volatile than changes in the Consumer Price Index may not be an effective risk-management tool. You may be hedging unexpected inflation but still increasing uncertainty over future consumption due to the volatility. Investments may also reduce portfolio risk if they increase diversification. But how should investors assess the diversification benefit? Although it is common to look at noisy correlation estimates, investors may want to ask whether the investment expands their opportunity set. If you’re only invested in US stocks, then expanding the portfolio globally improves diversification. The global stock market is worth around $80 trillion.1 Global bond markets tack on another $125 trillion.2 This is important context for the size of potential additions to your asset allocation and may be a helpful starting point for determining how much to invest in the asset. THE COST OF DOING BUSINESS The benefit of adding something to your portfolio must outweigh the drawbacks. An obvious drawback is high costs. Fees and expenses are typically transparent to investors, but it’s important to be aware of differences in fee structures. Traditional equity and fixed income mutual funds and ETFs usually use a flat percentage fee based on assets under management. Other asset classes may include performance fees. These structures may incentivize manager behavior in ways that are inconsistent with your investment objectives. A less-transparent cost (at least on expectation) is the potential for adverse selection. Whether we’re talking about the latest initial public offering (IPO) or a private equity placement, the most desirable allocations will have a line out the door. Investors without access to the most desirable investments will be left with suboptimal selections. This challenge is compounded if high minimum-investment thresholds are imposed, which may preclude diversified exposure across investments. An investment’s potential is more likely to be beneficial if you can stick with it through thick and thin. This is where complexity becomes a drawback. All investments go through periods of disappointing performance. The extent to which investors can endure these periods and stick with the investment plan may depend on how well they understand what drove performance. Transparency and trust tend to be highly correlated. All else equal, investors in opaque strategies or ones with less operational history may be less inclined to persevere in times of uncertainty. Finally, there’s the cost of wondering about the road not traveled. Adding a new investment means giving up some of what you already have. That presents the potential for regret if the asset you’re giving up goes on a strong performance run subsequent to the change. For example, many investors were tempted to jettison value portfolios in the wake of value stocks’ decade-long underperformance vs. growth prior to 2021. Replacing value right before its historic run in 2021 and the first half of 2022 may haunt investors for years to come. REAL-WORLD EXAMPLES We can put this framework to use with a few examples of notable alternative asset classes. Bitcoin The media fanfare around has left many investors wondering if they should dip their toe in the cryptocurrency waters. A few aspects of our evaluation framework are instantly relevant. Let’s start with the expected-return criterion. Little attention would be paid to bitcoin were it not for its meteoric rise in value in recent years.3 But it’s unclear why holding bitcoin should have a positive expected return. Bitcoin offers no claim on future cash flows, as one gets with a stock, and no promised interest payments, as one is entitled to with a bond. Future returns from simply holding bitcoin depend on it appreciating in value vs. another asset—the definition of a speculative investment. It is difficult to imagine uncertainty over lifetime consumption being reduced by an asset that has, multiple times, fallen in value by double-digit percentages in a single day. It's also not clear bitcoin or other cryptocurrencies can help investors manage risk. Using Professor French’s definition of risk, it is difficult to imagine uncertainty over lifetime consumption being reduced by an asset that has, multiple times, fallen in value by double-digit percentages in a single day. Another consideration is the size of the bitcoin market, which, at around $384 billion,4 is about 0.2% of the market value of global stock and bond markets. To put that in perspective, a $1 million portfolio composed of global stocks, global bonds, and bitcoin at market-cap weights would hold only about $2,000 in bitcoin. Managed Futures Managed-futures funds typically hold diversified futures contracts tied to various stock and bond indices. These strategies are often touted as diversifiers for traditional asset classes. While they may have low correlations with traditional equity portfolios, it is not because they expand an investor’s opportunity set; futures contracts are derivatives whose value is determined by the performance of the underlying asset. Derivatives may alter the so-called payout function of the asset, such as reducing downside exposure by forfeiting some potential upside, but they generally do not offer exposure to asset classes outside of traditional portfolio components. Costs are another consideration with managed-futures strategies. An academic study5 on managed-futures funds reported a gap between before-fees and after-fees measures of average returns of 4.52 percentage points per year. That’s a lot of performance being squeezed out before it can land in an investor’s hand. Thematic Funds Thematics represent a broad class of investment strategies that generally target themes, providing exposure to narrow subsets of the market, such as individual sectors or companies touted as potential beneficiaries of long-term economic trends. Proponents of thematic investing may subscribe to a high-expected-return story rooted in the premise that these investment styles are ahead of the curve. This is essentially a market-timing proposition, and the historical data are not kind to the success of market timing. Thematic funds therefore may not increase expected returns for investors already possessing exposure to the equity market. It’s also not clear thematic strategies increase diversification. For example, one thematic ETF focuses on companies expected to benefit from COVID-19-related paradigm shifts (work from home, attention to health, etc.). These aren’t new sectors—investors with globally diversified equity portfolios are likely holding these stocks already. ASKING THE RIGHT QUESTIONS Type I errors in asset allocation changes are expensive. Replacing an investment you once believed in with a shiny new product that doesn’t pan out is potentially detrimental to achieving your financial goals. A consistent evaluation framework helps investors mitigate the chance of this regret. These evaluation criteria can also be customized to individual preferences. After all, considerations like liquidity needs and risk tolerance often vary through an investor’s lifetime. At the end of the day, this framework is about asking the right questions, which, as researchers will tell you, is just as important as the answer itself. FOOTNOTES
1. Based on MSCI All Country World IMI Index as of December 31, 2021. 2. Based on statistics from the Bank for International Settlements (BIS) as of September 2021. 3. Cryptocurrency performance in 2022 has me wondering about the shelf life of this article. 4. Market capitalization from CoinMarketCap as of June 29, 2022. 5. Geetesh Bhardwaj, Gary B. Gorton, and K. Geert Rouwenhorst, "Fooling Some of the People All of the Time: The Inefficient Performance and Persistence of Commodity Trading Advisors" (working paper No. w14424, NBER, June 2022). DISCLOSURES Ken French is a member of the Board of Directors of the general partner of, and provides consulting services to, Dimensional Fund Advisors LP. The information in this material is intended for the recipient’s background information and use only. It is provided in good faith and without any warranty or representation as to accuracy or completeness. Information and opinions presented in this material have been obtained or derived from sources believed by Dimensional to be reliable and Dimensional has reasonable grounds to believe that all factual information herein is true as at the date of this material. It does not constitute investment advice, recommendation, or an offer of any services or products for sale and is not intended to provide a sufficient basis on which to make an investment decision. Before acting on any information in this document, you should consider whether it is suitable for your particular circumstances and, if appropriate, seek professional advice. It is the responsibility of any persons wishing to make a purchase to inform themselves of and observe all applicable laws and regulations. Unauthorized reproduction or transmitting of this material is strictly prohibited. Dimensional accepts no responsibility for loss arising from the use of the information contained herein. This material is not directed at any person in any jurisdiction where the availability of this material is prohibited or would subject Dimensional or its products or services to any registration, licensing or other such legal requirements within the jurisdiction. “Dimensional” refers to the Dimensional separate but affiliated entities generally, rather than to one particular entity. These entities are Dimensional Fund Advisors LP, Dimensional Fund Advisors Ltd., Dimensional Ireland Limited, DFA Australia Limited, Dimensional Fund Advisors Canada ULC, Dimensional Fund Advisors Pte. Ltd, Dimensional Japan Ltd. and Dimensional Hong Kong Limited. Dimensional Hong Kong Limited is licensed by the Securities and Futures Commission to conduct Type 1 (dealing in securities) regulated activities only and does not provide asset management services. Risks Investments involve risks. The investment return and principal value of an investment may fluctuate so that an investor’s shares, when redeemed, may be worth more or less than their original value. Past performance is not a guarantee of future results. There is no guarantee strategies will be successful. On May 4, the US Federal Reserve increased the target federal funds rate1 by 50 basis points as part of what the central bank said will be a series of rate increases to combat soaring inflation in the US. Some investors may worry that rising interest rates will decrease equity valuations and therefore lead to relatively poor equity market performance. However, history offers good news: Equity returns in the US have been positive on average following hikes in the fed funds rate. We study the relation between US equity returns, measured by the Fama/French Total US Market Research Index, and changes in the federal funds target rate from 1983 to 2021. Over this period of 468 months, rates increased in 70 months and decreased in 67 months. Exhibit 1 presents the average monthly returns of US equities in months when there is an increase, decrease, or no change in the target rate. On average, US equity market returns are reliably positive in months with increases in target rates.2 Moreover, the average stock market return in those months is similar to the average return in months with decreases or no changes in target rates. EXHIBIT 1 Reliably Rewarding US equity market returns and fed funds target rate change, January 1983–December 2021 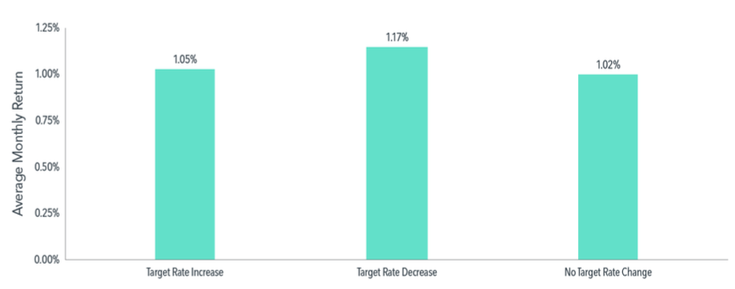 What about the months after rate hikes? This question may be of particular interest when the Fed is expected to increase the federal funds target rate multiple times. Exhibit 2 presents annualized US equity market returns over the one-, three-, and five-year periods following one or two consecutive monthly increases in the fed funds target rate, as well as following months with no increase. In reassuring news for investors concerned with the current environment of increasing rates, the US equity market has delivered strong longer-term performance on average regardless of activity at the Fed. EXHIBIT 2 Keep On Keeping On US equity market returns following consecutive fed funds rate hikes, January 1983–December 2021  With a number of Federal Open Market Committee meetings remaining in 2022, the Fed’s signals and actions will continue to be closely watched by the market. As the Fed often signals its agenda in advance, we believe market participants are already incorporating this information into market prices. While it’s natural to wonder what the Fed’s actions mean for equity performance, our research indicates that US equity markets offer positive returns on average following rate hikes. Thus, reducing equity allocations in anticipation of, or in reaction to, fed funds rate increases is unlikely to lead to better investment outcomes. Instead, investors who maintain a broadly diversified portfolio and use information in market prices to systematically focus on higher expected returns may be better positioned for long-term investment success. GLOSSARY
Basis point: One basis point (bps) equals 0.01%. FOOTNOTES 1. The federal funds rate is the interest rate at which depository institutions lend balances at the US Federal Reserve to other depository institutions overnight. 2. The Federal Open Market Committee (FOMC) holds eight regularly scheduled meetings per year and may not change the target rate at every meeting. The FOMC may also change the target rate multiple times within the same month; in such instances, we aggregate all changes by month. Past performance is not a guarantee of future results. Exhibit 1: Source: Monthly target federal funds rate data from Federal Reserve Bank of St. Louis. The monthly series reflects the federal funds target rate from January 1983 through December 2008 and the federal funds target range—upper limit (ul) from January 2009 through December 2021. Equity market returns computed using monthly return of the Fama/French Total US Market Research Index, available from Ken French Data Library. There are 70 months with a rate increase, 67 months with a rate decrease, and 331 months with no change. Exhibit 2: Source: Monthly target federal funds rate data from Federal Reserve Bank of St. Louis. The monthly series reflects the federal funds target rate from January 1983 through December 2008 and the federal funds target range—upper limit (ul) from January 2009 through December 2021. Equity market returns computed using monthly return to the Fama/French Total US Market Research Index, available from Ken French Data Library. There are 70 one-month rate hikes, 28 two- month rate hikes, and 389 months without an increase. Average annualized returns following consecutive rate increases starting at month end; performance time horizons can overlap. Eugene Fama and Ken French are members of the Board of Directors of the general partner of, and provide consulting services to, Dimensional Fund Advisors LP. This information is intended for educational purposes and should not be considered a recommendation to buy or sell a particular security. Dimensional Fund Advisors LP is an investment advisor registered with the Securities and Exchange Commission. After a strong year for the value premium, investors are curious about what that means for value performance for this year. ANNUAL VALUE PREMIUM AND FOLLOWING YEAR VALUE PREMIUM US Market, 1927–20211 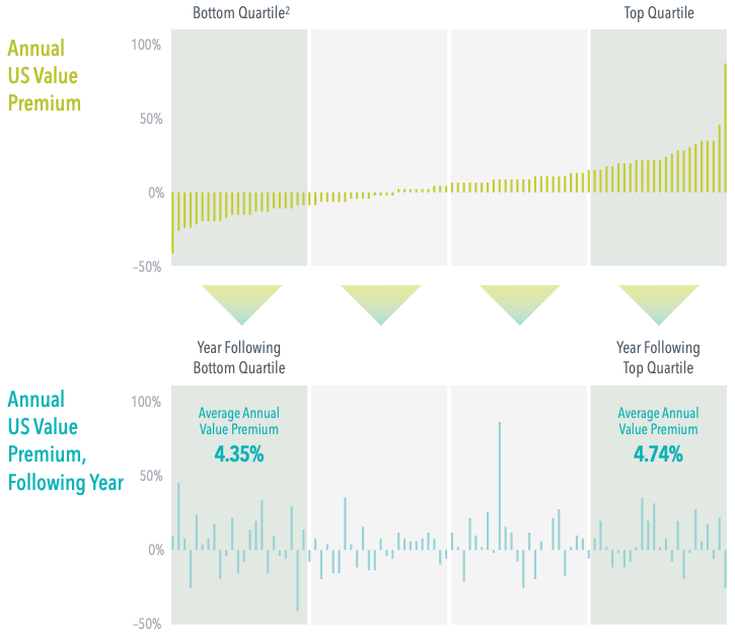
Investors haven’t missed the boat. Staying consistent in your exposure to the value premium can be the most reliable way to capture long-term returns. Data Appendix
1. Returns for 2021 are through the year-to-date period ending November 30, 2021. Returns less than one year are not annualized. 2. Yearly premiums in top chart are arranged from low to high rather than chronologically, covering 1927-2021. Premiums in bottom chart are arranged in the order of the top chart, but one year later in each instance, to show next-year performance. Past performance is not a guarantee of future results. Actual returns may be lower. Investing risks include loss of principal and fluctuating value. There is no guarantee an investment strategy will be successful. Indices are not available for direct investment; therefore, their performance does not reflect the expenses associated with the management of an actual portfolio. In USD. Annual value premium is the return difference between the Fama/French US Value Research Index and the Fama/French US Growth Research Index. Source: CRSP and Compustat data calculated by Dimensional. Fama/French data provided by Fama/French. Fama/French US Value Research Index: Provided by Fama/French from CRSP securities data. Includes the lower 30% in price-to-book of NYSE securities (plus NYSE Amex equivalents since July 1962 and Nasdaq equivalents since 1973). Fama/French US Growth Research Index: Provided by Fama/French from CRSP securities data. Includes the higher 30% in price-to-book of NYSE securities (plus NYSE Amex equivalents since July 1962 and Nasdaq equivalents since 1973). Eugene Fama and Ken French are members of the Board of Directors of the general partner of, and provide consulting services to, Dimensional Fund Advisors LP. This information is intended for educational purposes and should not be considered a recommendation to buy or sell a particular security. Dimensional Fund Advisors LP is an investment advisor registered with the Securities and Exchange Commission. How quickly things change. Two years ago, the New York Times reported, “Federal Reserve officials are increasingly worried that inflation is too low and could leave the central bank with less room to maneuver in an economic downturn.”1 More recently, a Wall Street Journal article presented a sharply different view, with a headline that likely touched a raw nerve among investors: “Everything Screams Inflation.” The author, a veteran financial columnist, observed, “We could be at a generational turning point for finance. Politics, economics, international relations, demography and labor are all shifting to supporting inflation.”2 Is inflation headed higher? In the short term, it has already moved that way. With many firms now reporting strong demand for goods and services following the swift collapse in business activity last year, prices are rising—sometimes substantially. Is this a negative? It depends on where one sits in the economic food chain. Airlines are once again enjoying fully booked flights, and many restaurants are struggling to hire cooks and waiters. We should not be surprised that airfares and steak dinners cost more than they did a year ago. Or that stock prices for JetBlue Airways and The Cheesecake Factory surged over 150% from their lows in the spring of 2020.3 Do such price increases signal a coming wave of broad and persistent inflation or just a temporary snapback following the unusually sharp economic downturn in 2020? We simply don’t know. But future inflation is just one of many factors that investors take into account. The market’s job is to take positive information, such as exciting new products, substantial sales gains, and dividend increases, and balance it against negative information, like falling profits, wars, and natural disasters, to arrive at a price every day that both buyers and sellers deem fair. The future is always uncertain. But willingness to bear uncertainty is the key reason investors have the opportunity for profit. Let us assume for the moment that rising inflation persists into the future. Some investors might want to hedge against higher inflation, while others might see it as a market-timing signal and make changes to their investment portfolios. But for the market timers to do so successfully, they would need a trading rule that directs exactly when and how to revise the portfolio—“I’ll know it when I see it” is not a strategy. A trading rule based on inflation estimates, however, is just a market-timing strategy dressed in different clothes. A successful effort requires two correct predictions: when to revise the portfolio and when to change it back. It’s not enough to be negative on the outlook for stocks or bonds in the face of disconcerting information regarding inflation (or anything else). Current prices already reflect such concerns. To justify switching a portfolio, one needs to be even more negative than the average investor. And then outsmart the crowd once again when the time appears right to switch back. Rinse and repeat. The evidence of success in pursuing such timing strategies—by individuals and professionals alike—is conspicuous by its absence. To illustrate the problem, imagine it’s New Year’s Day 1979. The broad US stock market4 produced a positive return in 1978 but failed to keep pace with inflation for the second year in a row. Your crystal ball informs you that the next two years will see back-to-back double-digit inflation for the first time since World War I. What would you do? You have painful memories of 1974, when the inflation-adjusted total return for US stocks was –35.05%, among the five worst returns in data going back to 1926. We suspect many investors would sell stocks in anticipation of significantly lower security prices over the subsequent two years. The result? Most likely a failure to capture above-average returns from both the equity and size dimensions, as shown in Exhibit 1. Exhibit 1 Looking Up Cumulative return, January 1979–December 1980 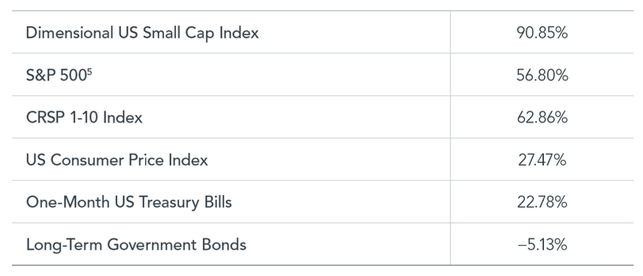 Past performance is no guarantee of future results. Indices are not available for direct investment. Some of the recent concern regarding inflation appears linked to substantial increases in government spending and the US debt load. Determining the appropriate level of each is a contentious public policy issue, and we don’t wish to minimize its importance. But the news items in Exhibit 2 suggest these concerns are not new, and the expected consequences of these issues are likely already reflected in current prices. The future is always uncertain. But as economist Frank Knight observed 100 years ago, willingness to bear uncertainty is the key reason investors have the opportunity for profit.6 Investors will always have something to worry about, and the possibility of unwelcome or unexpected events should be addressed by the portfolio’s initial design rather than by a hasty response to stressful headlines in the future. Exhibit 2 Fears Through the Years 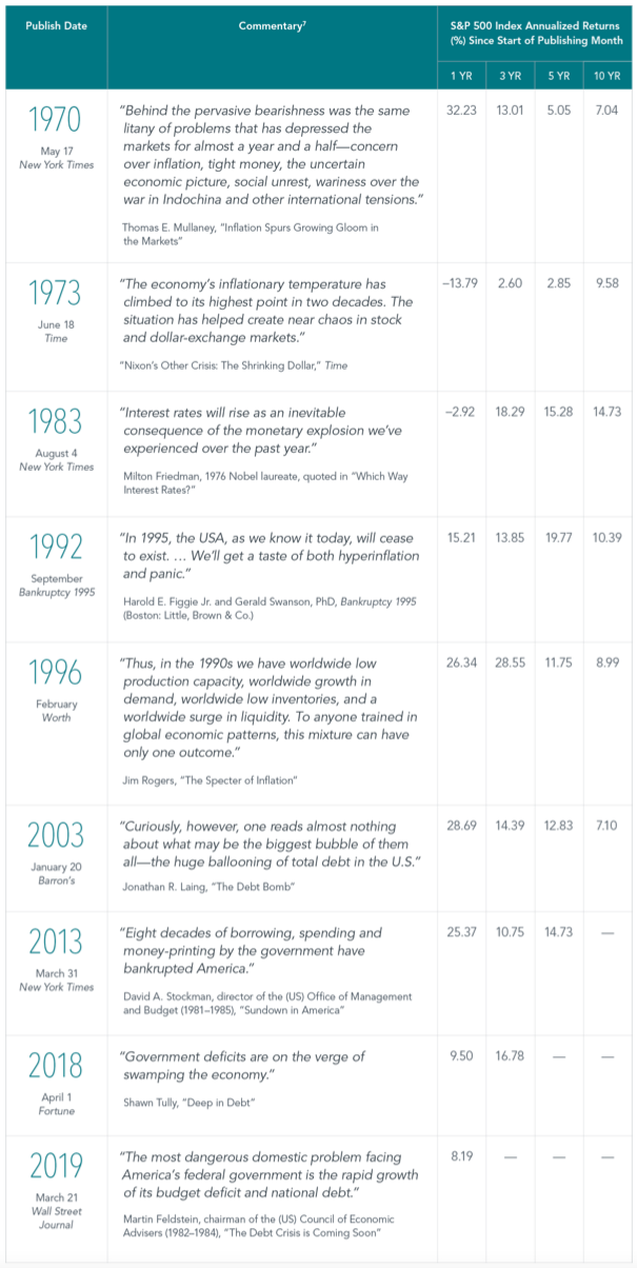 All data is from sources believed to be reliable but cannot be guaranteed or warranted. This information is intended for educational purposes, and it is not to be construed as an offer, solicitation, recommendation, or endorsement of any particular security, products, or services. No one should assume that any discussion or information contained in this material serves as a receipt of, or as a substitute for, personalized investment, tax or legal advice. Diversification does not eliminate the risk of market loss. Investment risks include loss of principal and fluctuating value. Past performance is not a guarantee of future results. Indices are not available for direct investment; therefore, their performance does not reflect the expenses associated with the management of an actual portfolio.
Data Appendix 'Everything Screams Inflation.' How to Interpret Headlines FOOTNOTES 1. Jeanna Smialek, “Fed Officials Sound Alarm Over Stubbornly Weak Inflation,” New York Times, May 17, 2019. 2. James Mackintosh, “Everything Screams Inflation,” Wall Street Journal, May 5, 2021. 3. Sourced using Bloomberg security returns. Low for Cheesecake Factory was April 2, 2020, and low for JetBlue was March 23, 2020. 4. As measured by the CRSP 1-10 index. 5. S&P data © S&P Dow Jones Indices LLC, a division of S&P Global. All rights reserved. 6. Frank H. Knight, Risk, Uncertainty and Profit (Boston and New York: Houghton Mifflin Co., 1921). 7. Headlines are sourced from various publicly available news outlets and are provided for context, not to explain the market’s behavior. This material is in relation to the US market and contains analysis specific to the US. 8. Jeanna Smialek, “Fed Officials Sound Alarm Over Stubbornly Weak Inflation,” New York Times, May 17, 2019. 9. James Mackintosh, “Everything Screams Inflation,” Wall Street Journal, May 5, 2021. 10. Sourced using Bloomberg security returns. Low for Cheesecake Factory was April 2, 2020, and low for JetBlue was March 23, 2020. 11. As measured by the CRSP 1-10 index. 12. S&P data © S&P Dow Jones Indices LLC, a division of S&P Global. All rights reserved. 13. Frank H. Knight, Risk, Uncertainty and Profit (Boston and New York: Houghton Mifflin Co., 1921). 14. Headlines are sourced from various publicly available news outlets and are provided for context, not to explain the market’s behavior. This material is in relation to the US market and contains analysis specific to the US. INDEX DESCRIPTIONS DIMENSIONAL US SMALL CAP INDEX: Compiled by Dimensional from CRSP and Compustat data. Market-capitalization-weighted index of securities of the smallest US companies whose market capitalization falls in the lowest 8% of the total market capitalization of the eligible market. The eligible market is composed of securities of US companies traded on the NYSE, NYSE MKT (formerly AMEX), and Nasdaq Global Market. Exclusions: non-US companies, REITs, UITs, investment companies, and companies with the lowest profitability and highest relative price within the small cap universe. The index also excludes those companies with the highest asset growth within the small cap universe. Profitability is defined as operating income before depreciation and amortization minus interest expense divided by book equity. Asset growth is defined as change in total assets from the prior fiscal year to current fiscal year. The index has been retrospectively calculated by Dimensional and did not exist prior to March 2007. Accordingly, the results shown during the periods prior to March 2007 do not represent actual returns of the index. Other periods selected may have different results, including losses. The calculation methodology for the index was amended in January 2014 to include profitability as a factor in selecting securities for inclusion in the index. The calculation methodology for the index was amended in December 2019 to include asset growth as a factor in selecting securities for inclusion in the index. “Dimensional” refers to the Dimensional separate but affiliated entities generally, rather than to one particular entity. These entities are Dimensional Fund Advisors LP, Dimensional Fund Advisors Ltd., Dimensional Ireland Limited, DFA Australia Limited, Dimensional Fund Advisors Canada ULC, Dimensional Fund Advisors Pte. Ltd., Dimensional Japan Ltd., and Dimensional Hong Kong Limited. Dimensional Hong Kong Limited is licensed by the Securities and Futures Commission to conduct Type 1 (dealing in securities) regulated activities only and does not provide asset management services. UNITED STATES: Dimensional Fund Advisors LP is an investment advisor registered with the Securities and Exchange Commission. When the prices of goods and services increase over time, consumers can buy fewer of them with every dollar they have saved. This erosion of the real purchasing power of wealth is called inflation. Inflation is an important element of investing. In many cases, the reason for saving today is to support future spending. Therefore, keeping pace with inflation is a crucial goal for many investors. To help understand inflation’s impact on purchasing power, consider the following illustration of the effects of inflation over time. In 1916, nine cents would buy a quart of milk. Fifty years later, nine cents would only buy a small glass of milk. And more than 100 years later, nine cents would only buy about seven tablespoons of milk. How can investors potentially prevent this loss of purchasing power from inflation over time? Exhibit 1: Your Money Today Will Likely Buy Less Tomorrow 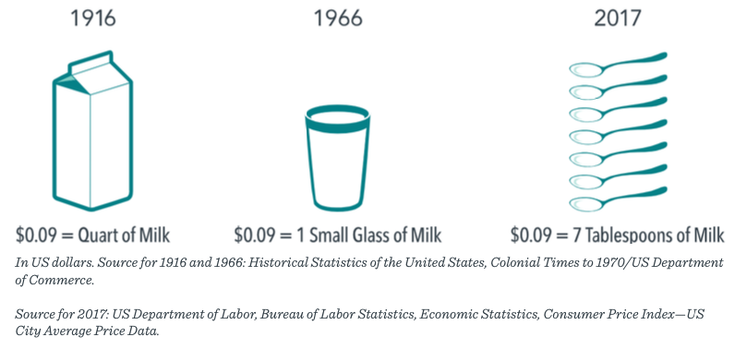 INVESTING FOR THE LONG TERM AND OTHER "TIPS" As the value of a dollar declines over time, investing can help grow wealth and preserve purchasing power. Investors should know that over the long haul stocks have historically outpaced inflation, but there have also been short-term stretches where this has not been the case. For example, during the 17-year period from 1966–1982, the return of the S&P 500 Index was 6.8% before inflation, but after adjusting for inflation it was 0%. Additionally, if we look at the period from 2000–2009, the so-called “lost decade,” the return of the S&P 500 Index dropped from –0.9% before inflation to –3.4% after inflation. Despite some periods where stocks have failed to outpace inflation, one dollar invested in the S&P 500 Index in 1926, after accounting for inflation, would have grown to more than $500 of purchasing power at the end of 2017 and would have significantly outpaced inflation over the long run. The story for US Treasury bills (T-bills), however, is quite different. In many periods, T-bills were unable to keep pace with inflation, and an investor would have experienced an erosion of purchasing power. After adjusting for inflation, one dollar invested in T-bills in 1926 would have grown to only $1.51 at the end of 2017. Exhibit 2: Growth of $1 1926–2017 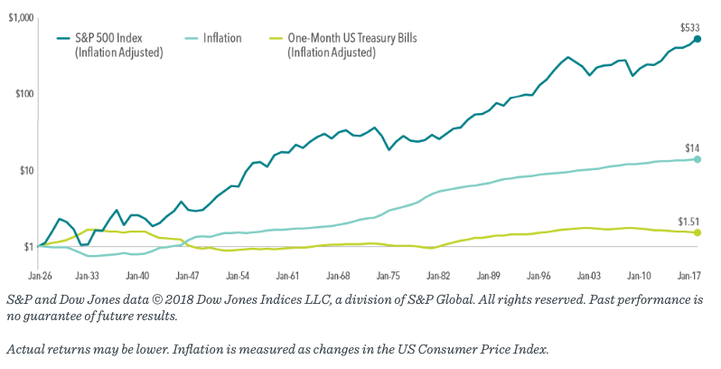 While stocks are more volatile than T-bills, they have also been more likely to outpace inflation over long periods. The lesson here is that volatility is not the only type of risk that should concern investors. Ultimately, many investors may need to have some of their allocation in growth investments that outpace inflation to maintain their standard of living and grow their wealth. One additional tool available to investors who are concerned about both stock market volatility and inflation are Treasury Inflation-Protected Securities (TIPS). TIPS are guaranteed by the US Treasury and as such are considered by the marketplace to have low risk of default. The Treasury issues TIPS with a variety of maturities, and these securities are easily bought and sold. Unlike traditional Treasury securities such as T-bills, TIPS are indexed to inflation to protect investors from an erosion in purchasing power. As inflation (measured by the consumer price index) rises, so does the par value of TIPS, while the interest rate remains fixed. This means that if inflation unexpectedly rises, the purchasing power of any principal invested in TIPS should also increase.1 Although they may not offer the long-term growth opportunities that stocks do, their structure makes TIPS an effective risk management tool for investors who are concerned with managing uncertainty around future purchasing power. CONCLUSION Inflation is an important consideration for many long-term investors. By combining the right mix of growth and risk management assets, investors may be able to blunt the effects of inflation and grow their wealth over time. Remember, however, that inflation is only one consideration among many that investors must contend with when building a portfolio for the future. The right mix of assets for any investor will depend upon that investor’s unique goals and needs. All data is from sources believed to be reliable but cannot be guaranteed or warranted. This information is intended for educational purposes, and it is not to be construed as an offer, solicitation, recommendation, or endorsement of any particular security, products, or services. No one should assume that any discussion or information contained in this material serves as a receipt of, or as a substitute for, personalized investment, tax or legal advice. Diversification does not eliminate the risk of market loss. Investment risks include loss of principal and fluctuating value. Past performance is not a guarantee of future results. Indices are not available for direct investment; therefore, their performance does not reflect the expenses associated with the management of an actual portfolio.
Appendix How Does Inflation Impact Investors? 1. Market prices incorporate market participants’ expectations about the future. Therefore, market participants’ expectations about future inflation should be incorporated into current prices. These expectations are referred to as expected inflation. Unexpected inflation refers to unexpected changes in inflation that deviate from prior market expectations. Unexpected inflation should be considered a primary driver of inflation risk. Investing risks include loss of principal and fluctuating value. There is no guarantee an investing strategy will be successful. Fixed income investments are subject to interest rate, credit, and inflation risk. Inflation-protected securities may react differently from other debt securities to changes in interest rates. In periods of no or low inflation, other investments, including other Treasury bonds, may perform better than TIPS. The information in this material is intended for the recipient’s background information and use only. It is provided in good faith and without any warranty or, representation as to accuracy or completeness. Information and opinions presented in this material have been obtained or derived from sources believed by the Issuing Entity to be reliable and the Issuing Entity has reasonable grounds to believe that all factual information herein is true as at the date of this document. It does not constitute investment advice, recommendation, or an offer of any services or products for sale and is not intended to provide a sufficient basis on which to make an investment decision. It is the responsibility of any persons wishing to make a purchase to inform themselves of and observe all applicable laws and regulations. Unauthorized reproduction or transmitting of this material is strictly prohibited. The Issuing Entity does not accept responsibility for loss arising from the use of the information contained herein. As companies grow to become some of the largest firms trading on the US stock market, the returns that push them there can be impressive. But not long after joining the Top 10 largest by market cap, these stocks, on average, lagged the market. Ave Annualized Outperformance of Companies Before and After the First Year They Became One of the 10 Largest in the US Compared to Fama/French Total US Market Research Index,1927–2020 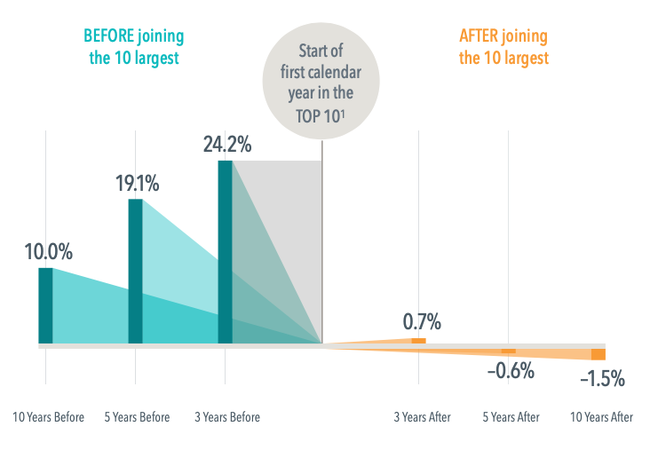
Expectations about a firm’s prospects are reflected in its current stock price. Positive news might lead to additional price appreciation, but those unexpected changes are not predictable. Appendix
Why Investors Might Think Twice About Chasing the Biggest Stocks 1. Ten largest companies by market capitalization. 2. Returns are measured as of start of first calendar year after a stock joins Top 10. Past performance is no guarantee of future results. Indices are not available for direct investment; therefore, their performance does not reflect the expenses associated with the management of an actual portfolio. This information is intended for educational purposes and should not be considered a recommendation to buy or sell a particular security. Named securities may be held in accounts managed by Dimensional. In USD. Source: Dimensional, using data from CRSP. Includes all US common stocks excluding REITs. Largest stocks identified at the end of each calendar year by sorting eligible US stocks on market capitalization. Market is represented by the Fama/French Total US Market Research Index. Annualized Excess Return is the difference in annualized compound returns between the stock and the market over the 3-, 5-, and 10-year periods, before and after each stocks’ initial year-end classification in the top 10. 3-, 5-, and 10-annualized returns are computed for companies with return data available for the entire 3-, 5-, and 10-year periods respectively. The number of firm included in measuring excess returns prior (subsequent) to becoming a top 10 stock consists of 39 (54) for 3-year, 38 (53) for 5-year, and 30 (47) for 10-year. Fama/French Total US Market Research Index: The value-weighed US market index is constructed every month, using all issues listed on the NYSE, AMEX, or Nasdaq with available outstanding shares and valid prices for that month and the month before. Exclusions: American Depositary Receipts. Sources: CRSP for value-weighted US market return. Rebalancing: Monthly. Dividends: Reinvested in the paying company until the portfolio is rebalanced. Eugene Fama and Ken French are members of the Board of Directors of the general partner of, and provide consulting services to, Dimensional Fund Advisors LP. Dimensional Fund Advisors LP is an investment advisor registered with the Securities and Exchange Commission. The information in this material is intended for the recipient’s background information and use only. It is provided in good faith and without any warranty or, representation as to accuracy or completeness. Information and opinions presented in this material have been obtained or derived from sources believed by the Issuing Entity to be reliable and the Issuing Entity has reasonable grounds to believe that all factual information herein is true as at the date of this document. It does not constitute investment advice, recommendation, or an offer of any services or products for sale and is not intended to provide a sufficient basis on which to make an investment decision. It is the responsibility of any persons wishing to make a purchase to inform themselves of and observe all applicable laws and regulations. Unauthorised reproduction or transmitting of this material is strictly prohibited. The Issuing Entity does not accept responsibility for loss arising from the use of the information contained herein.  You only live once! Social media investors have banded together on unconventional platforms to drive up the prices of a handful of “meme stocks,” seemingly without traditional evaluation of investing risks and rewards. They made headlines with their “short squeeze” of GameStop (GME), and, as they garner media attention, their tactics continue. While it’s not the intended victim of the YOLO traders, will the efficient market hypothesis be a casualty of these events? The answer depends a lot on your definition of efficient markets. Perhaps long-term investors would be better served questioning the potential impact on their investment philosophy. Fama (1970) defines the efficient market hypothesis (EMH) to be the simple statement that prices reflect all available information. The rub is that it doesn’t say how investors should use this information. EMH is silent on the “correct” ways investors should use information and prices should be set. To be testable, EMH needs a companion model: a hypothesis for how markets and investors should behave. This leaves a lot of room for interpretation. Should asset prices be set by rational investors whose only concerns are systematic risk1 and expected returns? It seems implausible to link recent meme-stock price movements to economic risks. Rather, they seem fueled by investor demand to be part of a social movement, hopes to strike it rich with a lucky stock pick, or plain old schadenfreude. There is a vast ecosystem of investors, from individuals investing in their own accounts to governments and corporations who invest on behalf of thousands. Ask investors why they invest the way they do, and you’ll likely get a range of goals and approaches just as diverse. It’s this complex system that generates the demand for stocks. Another complex system fuels the supply of stocks. Supply and demand meet at the market price. People may contend that the market is not always efficient, or rational, but the stock market is always in equilibrium. Every trade has two sides, with a seller for every buyer and a profit for every loss. There are plenty of well-studied examples that show supply and demand at work. The huge increase in demand for stocks added to a well-tracked index often creates a run-up in the stock price. Some of this price increase can be temporary and reversed once the tremendous liquidity demands at index reconstitution2 are met. Index reconstitution is just one example; instances of liquidity-driven price movements happen all the time. It is well documented that liquidity demands can produce temporary price movements.3 Investors may wonder if temporary price dislocations motivated by users of r/WallStreetBets differ from those caused by changes to an index. Lots of buying puts temporary upward pressure on prices, which later fall back to “fundamental value”–it sounds familiar. The more relevant observation may be that markets are complex systems well adapted to facilitate the supply and demand of numerous market participants. There are numerous reasons people may be willing to hold different stocks at different expected returns. Can all those differences be explained by risks? Doubtful. To quote Professor Fama, “The point is not that markets are efficient. They’re not. It’s just a model.”4 EMH can be a very useful model to inform how investors should behave. We believe investing as if markets are efficient is a good philosophy for building long-term wealth. Trying to outguess markets might be a quick way to destroy wealth. It’s true, you only live once. The good news is that investors can look to market prices, not internet fads, to pursue higher expected returns. Theoretical and empirical research indicate higher expected returns come from lower relative prices and higher future cash flows to investors. Long-run investors can be better served by using markets, rather than chatrooms, for information on expected returns. Appendix
YOLO, Meme, and EMH: What's Your Investment Style? 1. Systematic risk is the possibility of an investor experiencing losses due to factors that affect the overall performance of the financial markets in which he or she is involved. 2. Reconstitution involves the re-evaluation of a market index. The process involves sorting, adding, and removing stocks to ensure that the index reflects up-to-date market capitalization and style. 3. For example, see "Tesla’s Charge Reveals Weak Points of Indexing" (Dimensional, 2021) 4. "Are markets efficient?" – Interview between Eugene Fama and Richard Thaler (June 30, 2016) The information in this material is intended for the recipient’s background information and use only. It is provided in good faith and without any warranty or, representation as to accuracy or completeness. Information and opinions presented in this material have been obtained or derived from sources believed by the Issuing Entity to be reliable and the Issuing Entity has reasonable grounds to believe that all factual information herein is true as at the date of this document. It does not constitute investment advice, recommendation, or an offer of any services or products for sale and is not intended to provide a sufficient basis on which to make an investment decision. It is the responsibility of any persons wishing to make a purchase to inform themselves of and observe all applicable laws and regulations. Unauthorised reproduction or transmitting of this material is strictly prohibited. The Issuing Entity does not accept responsibility for loss arising from the use of the information contained herein. The year 2020 proved to be one of the most tumultuous in modern history, marked by a number of developments that were historically unprecedented. But the year also demonstrated the resilience of people, institutions, and financial markets. The novel coronavirus was already in the news early in the year, and concerns grew as more countries began reporting their first cases of COVID-19. Infections multiplied around the world through February, and by early March, when the outbreak was labeled a pandemic, it was clear that the crisis would affect nearly every area of our lives. The spring would see a spike in cases and a global economic contraction as people stayed closer to home, and another surge of infections would come during the summer. Governments and central banks worked to cushion the blow, providing financial support for individuals and businesses and adjusting lending rates. On top of the health crisis, there was widespread civil unrest over the summer in the US tied to policing and racial justice. In August, Americans increasingly focused on the US presidential race in this unusual year. Politicians, supporters, and voting officials wrestled with the challenges of a campaign that at times was conducted virtually and with an election in the fall that would include a heightened level of mail-in and early voting. In the end, the results of the election would be disputed well into December. As autumn turned to winter, 2020 would end with both troubling and hopeful news: yet another spike in COVID-19 cases, along with the first deliveries of vaccines in the US and elsewhere. For investors, the year was characterized by sharp swings for stocks. March saw a 33.79% drop in the S&P 500 Index1 as the pandemic worsened. This was followed by a rally in April, and stocks reached their previous highs by August. Ultimately, despite a sequence of epic events and continued concerns over the pandemic, global stock market returns in 2020 were above their historical norm. The US market finished the year in record territory and with an 18.40% annual return for the S&P 500 Index. Non-US developed markets, as measured by the MSCI World ex USA Index,2 returned 7.59%. Emerging markets, as measured by the MSCI Emerging Markets Index, returned 18.31% for the year. Exhibit 1: Highs and Lows MSCI All Country World Index with selected headlines from 2020 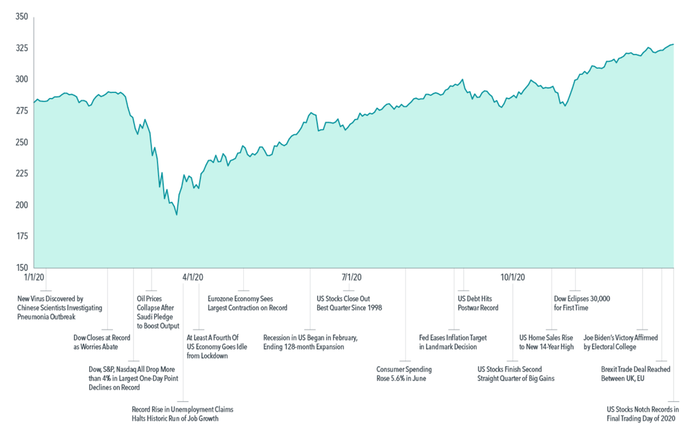 Fixed income markets mirrored the extremity of equity behavior, with nearly unprecedented dispersion in returns during the first half of 2020. For example, in the first quarter, US corporate bonds underperformed US Treasuries by more than 11%, the most negative quarterly return difference in data going back a half century. But they soon swapped places: the second quarter was the second-most positive one on record for corporates over Treasuries, with a 7.74% advantage.3 Large return deviations were also observed between US and non-US fixed income as well as between inflation-protected and nominal bonds. Global yield curves finished the year generally lower than at the start. US Treasury yields, for example, fell across the board, with drops of more than 1% on the short and intermediate portions of the curve.4 The US Treasury curve ended relatively flat in the short-term segment but upwardly sloped from the intermediate- to long-term segment. For 2020, the Bloomberg Barclays Global Aggregate Bond Index5 returned 5.58%. Exhibit 2: Sharp Shifts US Credit minus US Treasury: Quarterly Returns, March 1973– December 2020 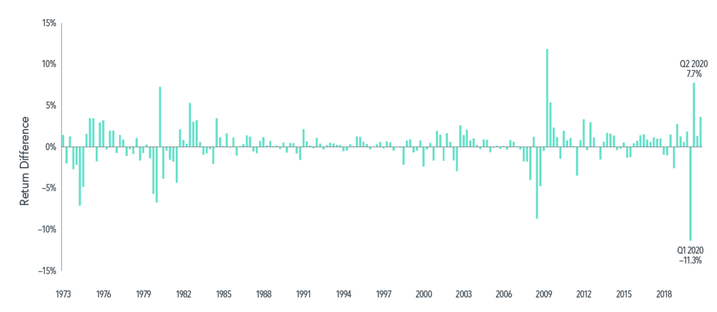 Uncertainty remains about the pandemic and the broad impact of the new vaccines, continued lockdowns, and social distancing. But the events of 2020 provided investors with many lessons, affirming that following a disciplined and broadly diversified investment approach is a reliable way to pursue long-term investment goals. MARKET PRICES QUICKLY REFLECT NEW INFORMATION ABOUT THE FUTURE The fluctuating markets in the spring and summer were also a lesson in how markets incorporate new information and changes in expectations. From its peak on February 19, 2020, the S&P 500 Index fell 33.79% in less than five weeks as the news headlines suggested more extreme outcomes from the pandemic. But the recovery would be swift as well. Market participants were watching for news that would provide insights into the pandemic and the economy, such as daily infection and mortality rates, effective therapeutic treatments, and the potential for vaccine development. As more information became available, the S&P 500 Index jumped 17.57% from its March 23 low in just three trading sessions, one of the fastest snapbacks on record. This period highlighted the vital role of data in setting market expectations and underscored how quickly prices adjust to new information. One major theme of the year was the perceived disconnect between markets and the economy. How could the equity markets recover and reach new highs when the economic news remained so bleak? The market’s behavior suggests investors were looking past the short-term impact of the pandemic to assess the expected rebound of business activity and an eventual return to more-normal conditions. Seen through that lens, the rebound in share prices reflected a market that is always looking ahead, incorporating both current news and expectations of the future into stock prices. OWNING THE WINNERS AND LOSERS The 2020 economy and market also underscored the importance of staying broadly diversified across companies and industries. The downturn in stocks impacted some segments of the market more than others in ways that were consistent with the impact of the COVID-19 pandemic on certain types of businesses or industries. For example, airline, hospitality, and retail industries tended to suffer disproportionately with people around the world staying at home, whereas companies in communications, online shopping, and technology emerged as relative winners during the crisis. However, predicting at the beginning of 2020 exactly how this might play out would likely have proved challenging. In the end, the economic turmoil inflicted great hardship on some firms while creating economic and social conditions that provided growth opportunities for other companies. In any market, there will be winners and losers-and investors have historically been well served by owning a broad range of companies rather than trying to pick winners and losers. STICKING WITH YOUR PLAN Many news reports rightly emphasized the unprecedented nature of the health crisis, the emergency financial actions, and other extraordinary events during 2020. The year saw many “firsts”—and subsequent years will doubtless usher in many more. Yet 2020’s outcomes remind us that a consistent investment approach is a reliable path regardless of the market events we encounter. Investors who made moves by reacting to the moment may have missed opportunities. In March, spooked investors fled the stock and bond markets, as money-market funds experienced net flows for the month totaling $684 billion. Then, over the six-month period from April 1 to September 30, global equities and fixed income returned 29.54% and 3.16%, respectively. A move to cash in March may have been a costly decision for anxious investors. Exhibit 3: Cash Concerns in 2020 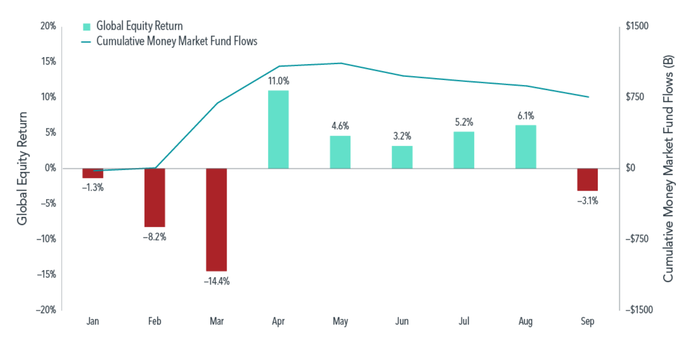 It was important for investors to avoid reacting to the dispersion in performance between asset classes, too, lest they miss out on turnarounds from early in the year to later. For example, small cap stocks on the whole fared better in the second half of the year than the first. The stark difference in performance between the first and second quarters across bond classes also drives home this point. A WELCOME TURN OF THE CALENDAR Moving into 2021, many questions remain about the pandemic, new vaccines, business activity, changes in how people work and socialize, and the direction of global markets. Yet 2020’s economic and market tumult demonstrated that markets continue to function and that people can adapt to difficult circumstances. The year’s positive equity and fixed income returns remind that, with a solid investment approach and a commitment to staying the course, investors can focus on building long-term wealth, even in challenging times. All data is from sources believed to be reliable but cannot be guaranteed or warranted. This information is intended for educational purposes, and it is not to be construed as an offer, solicitation, recommendation, or endorsement of any particular security, products, or services. No one should assume that any discussion or information contained in this material serves as a receipt of, or as a substitute for, personalized investment, tax or legal advice. Diversification does not eliminate the risk of market loss. Investment risks include loss of principal and fluctuating value. Past performance is not a guarantee of future results. Indices are not available for direct investment; therefore, their performance does not reflect the expenses associated with the management of an actual portfolio.
Appendix Looking Back on an Unprecedented Year Past performance is no guarantee of future results. Exhibit 1: In US dollars, net dividends. MSCI data © MSCI 2021, all rights reserved. Indices are not available for direct investment. Index returns are not representative of actual portfolios and do not reflect costs and fees associated with an actual investment. Exhibit 2: In US dollars. US credit represented by the Bloomberg Barclays US Credit Bond Index. US Treasuries represented by the Bloomberg Barclays US Treasury Bond Index. Bloomberg Barclays data provided by Bloomberg. Indices are not available for direct investment. Index returns are not representative of actual portfolios and do not reflect costs and fees associated with an actual investment. Exhibit 3: In US dollars. Global equity returns is the MSCI All Country World IMI Index (net div.). MSCI data © MSCI 2021, all rights reserved. Money market fund flows provided by Morningstar. Indices are not available for direct investment. Index returns are not representative of actual portfolios and do not reflect costs and fees associated with an actual investment. 1. S&P data © 2021 S&P Dow Jones Indices LLC, a division of S&P Global. All rights reserved. Indices are not available for direct investment. 2. MSCI data © MSCI 2021, all rights reserved. Indices are not available for direct investment. 3. US corporate bonds represented by the Bloomberg Barclays US Credit Bond Index. US Treasuries represented by the Bloomberg Barclays US Treasury Bond Index. Bloomberg Barclays data provided by Bloomberg. Indices are not available for direct investment. 4. ICE BofA government yield. ICE BofA index data © 2021 ICE Data Indices, LLC. 5. Bloomberg Barclays data provided by Bloomberg. All rights reserved. Indices are not available for direct investment. The information in this material is intended for the recipient’s background information and use only. It is provided in good faith and without any warranty or, representation as to accuracy or completeness. Information and opinions presented in this material have been obtained or derived from sources believed by the Issuing Entity to be reliable and the Issuing Entity has reasonable grounds to believe that all factual information herein is true as at the date of this document. It does not constitute investment advice, recommendation, or an offer of any services or products for sale and is not intended to provide a sufficient basis on which to make an investment decision. It is the responsibility of any persons wishing to make a purchase to inform themselves of and observe all applicable laws and regulations. Unauthorised reproduction or transmitting of this material is strictly prohibited. The Issuing Entity does not accept responsibility for loss arising from the use of the information contained herein. Many investors view dividend payouts as a reliable source of income. However, those expecting to receive consistent dividend income may have been surprised to see lower- than-expected dividend payouts following the onset of the coronavirus pandemic, when both market volatility and market declines were extraordinary. In reality, recent and historical data show that changes in dividend policy are common, especially during times of higher uncertainty. Aggregate dividend payouts fell meaningfully in the first three quarters of 2020 compared to the same period in 2019. Exhibit 1 shows the dividends earned from a hypothetical $1 million investment in US, developed ex US, and emerging markets in both periods. Developed ex US markets showed the most drastic change with a 41% decrease. Dividend payments in emerging markets decreased by 29% and in US markets by 22%. Exhibit 1 Drop Zone Dividends from a Hypothetical $1 Million Investment 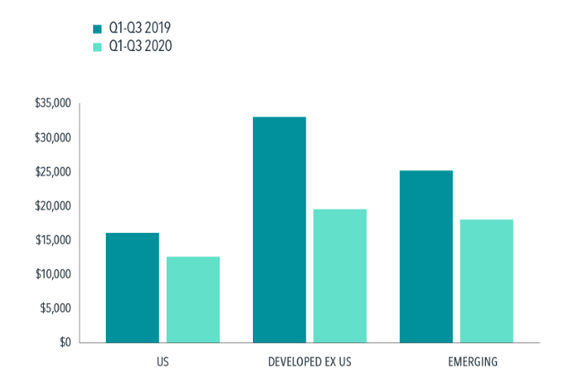 Globally, large firms have historically had the highest propensity to offer dividend payouts,1 but even successful, established firms were not immune to the economic consequences of a global pandemic. A few examples help illustrate this point. Harley Davidson (HOG) has been paying dividends to shareholders since the 1990s. In April 2020, the motorcycle manufacturer slashed its dividend from $0.38 per share to just $0.02, a 95% decrease.2 Gap Inc. (GPS) suspended its dividend payments until at least April 20213 after the economic downturn left the clothing brand with particularly poor revenues. Harley Davidson and Gap were not the only firms to change their dividend policies. As shown in Exhibit 2, 38% of firms in global markets (2,584 companies) that were expected to pay dividends, consistent with their payout history, instead decreased, omitted, or eliminated their dividend payments in the second quarter, more than doubling the 1,248 firms that made similar changes to their dividend policy in the first quarter of the year. The trend continued into the third quarter: 2,699 firms made such changes. Exhibit 2 Changing Tune Dividend Policy Changes in Global Markets (% of Dividend- Paying Firms), 2020 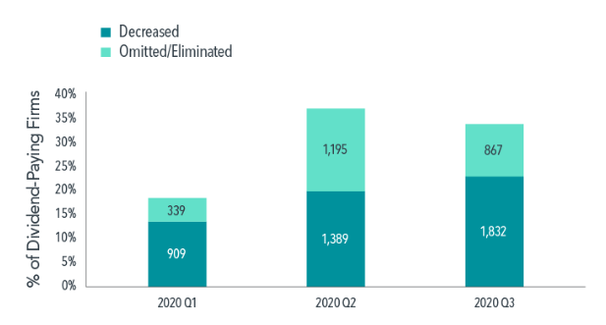 While these dividend cuts may come as a surprise to some investors, history buffs may recall that, in 2009, Harley Davidson announced it was cutting dividend payouts from $0.33 per share to $0.10, a 70% decrease.4 In fact, during the Great Recession, significant changes to firms’ dividend policies spiked throughout global markets. Exhibit 3 displays Fama/French global market returns for 1991–2019 with a one-year lag and the proportion of dividend-paying firms that eliminated or decreased their dividend payouts. In 2008, for example, the global market was down more than 40%, and, the following year, many firms made changes to their dividend policies. The historical correlation between global market returns and dividends that are eliminated or decreased may suggest that firms are more likely to alter their dividend payouts during times of market instability. Exhibit 3 In Step Global Market Returns and Dividend Changes 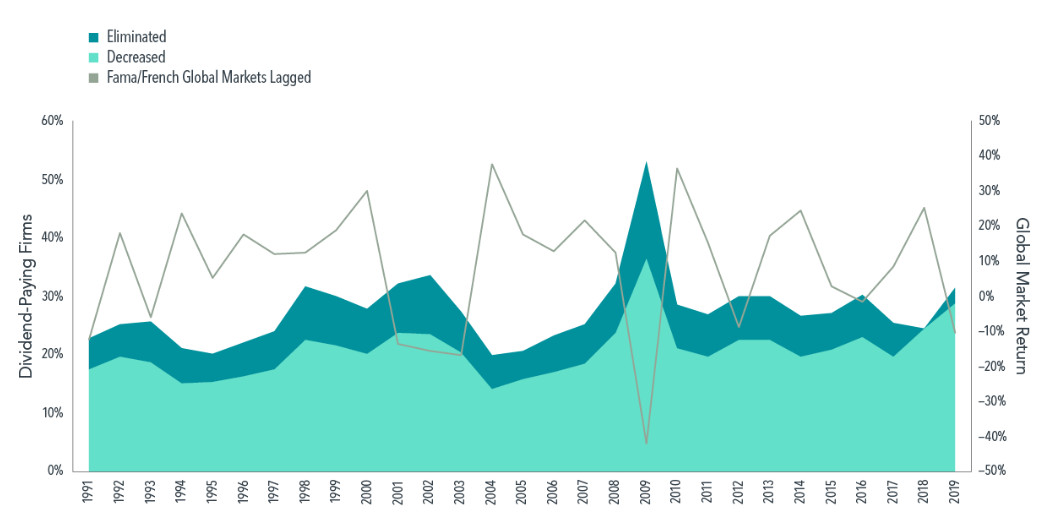 The first three quarters of 2020 remind us that dividend payouts can be inconsistent, particularly in volatile markets. Hence, investment strategies that focus on income derived from dividends may not serve investors who need a steady income stream and, moreover, might not be the most effective way to pursue long-term wealth growth. A more reliable approach is to structure equity asset allocation around the characteristics that research demonstrates drive long-term higher expected returns, namely size, relative price, and profitability, while maintaining broad diversification across names, sectors, and countries. All data is from sources believed to be reliable but cannot be guaranteed or warranted. This information is intended for educational purposes, and it is not to be construed as an offer, solicitation, recommendation, or endorsement of any particular security, products, or services. No one should assume that any discussion or information contained in this material serves as a receipt of, or as a substitute for, personalized investment, tax or legal advice. Diversification does not eliminate the risk of market loss. Investment risks include loss of principal and fluctuating value. Past performance is not a guarantee of future results. Indices are not available for direct investment; therefore, their performance does not reflect the expenses associated with the management of an actual portfolio.
Dividends in the Time of COVID-19 FOOTNOTES 1Stanley Black, “Global Dividend-Paying Stocks: A Recent History” (white paper, Dimensional Fund Advisors, March 2013). 2Harley-Davidson, Inc., “Dividends & Stock Splits,” investor.harley-davidson.com/stock-info/dividends-and-stock-split. 3Gap Inc., “Gap Inc. Provides Update In Response To Covid-19 Outbreak,” news release, March 26, 2020, investors.gapinc.com/press-releases/news-details/2020/GAP-INC-PROVIDES-UPDATE-IN-RESPONSE-TO-COVID-19-OUTBREAK/default.aspx 4Harley-Davidson, Inc., “Dividends & Stock Splits.” Exhibit 1 Source: Calculated by Dimensional from Bloomberg data. In USD. Each hypothetical investment includes all securities in the investable equity universe in the applicable region at free-float market cap weight as determined at the beginning of each year. To be included in the investable equity universe, securities must meet certain minimum capitalization and liquidity requirements. Investment companies are excluded. Exhibit 2 Source: Calculated by Dimensional from Bloomberg data. Dividend-paying firms include all firms that have paid a dividend in the preceding 12 months and were expected to pay a dividend in the current quarter. Exhibit 3 Note: Global Market return is free-float market cap weighted average of Fama/French Developed Markets and Emerging Markets Indexes. See Index Descriptions in the disclosures for descriptions of Fama/French index data. Source: Calculated by Dimensional from Bloomberg data. Past performance is no guarantee of future results. Dividend- paying firms include all firms that paid a dividend in the prior calendar year. The information in this material is intended for the recipient’s background information and use only. It is provided in good faith and without any warranty or, representation as to accuracy or completeness. Information and opinions presented in this material have been obtained or derived from sources believed by the Issuing Entity to be reliable and the Issuing Entity has reasonable grounds to believe that all factual information herein is true as at the date of this document. It does not constitute investment advice, recommendation, or an offer of any services or products for sale and is not intended to provide a sufficient basis on which to make an investment decision. It is the responsibility of any persons wishing to make a purchase to inform themselves of and observe all applicable laws and regulations. Unauthorised reproduction or transmitting of this material is strictly prohibited. The Issuing Entity does not accept responsibility for loss arising from the use of the information contained herein. Eugene Fama and Ken French are members of the Board of Directors of the general partner of, and provide consulting services to, DFAL and DIL. In USD. Index DescriptionsFama/French Developed Markets Index: July 1990–present: Courtesy of Fama/French from Bloomberg securities data. Companies weighted by market cap; rebalanced annually in June. Fama/French Emerging Markets Index: July 1989–present: Courtesy of Fama/French from Bloomberg and IFC securities data. Companies weighted by float-adjusted market cap; rebalanced annually in June. It’s natural for investors to look for a connection between who wins the White House and which way stocks will go. But as nearly a century of returns shows, stocks have trended upward across administrations from both parties. GROWTH OF $100 Fama/French Total US Market Research Index: March 4, 1929 - June 30, 2020 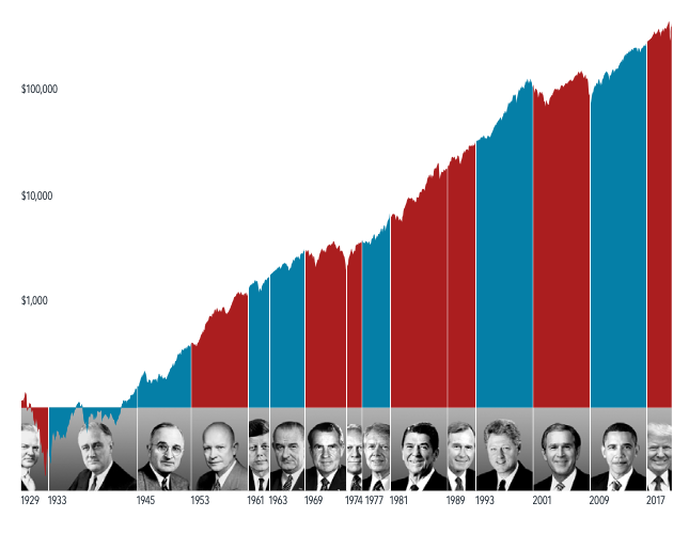
Stocks have rewarded disciplined investors for decades, through Democratic and Republican presidencies. It’s an important lesson on the benefits of a long-term investment approach. What History Tells Us About Elections and the Market: In US dollars. Growth of wealth shows the growth of a hypothetical investment of $100 in the securities in the Fama/French US Total Market Research Index. The chart begins with the start of the first full presidential term (March 4, 1929) for which Fama/French Total US Market Research Index data is available and ends on June 30, 2020. Data presented in the growth of wealth chart is hypothetical and assumes reinvestment of income and no transaction costs or taxes. The chart is for illustrative purposes only and is not indicative of any investment.
Fama/French Total US Market Research Index: The value-weighed US market index is constructed every month, using all issues listed on the NYSE, AMEX, or Nasdaq with available outstanding shares and valid prices for that month and the month before. Exclusions: American Depositary Receipts. Sources: CRSP for value-weighted US market return. Rebalancing: Monthly. Dividends: Reinvested in the paying company until the portfolio is rebalanced. Eugene Fama and Ken French are members of the Board of Directors of the general partner of, and provide consulting services to, Dimensional Fund Advisors LP. Dimensional Fund Advisors LP is an investment advisor registered with the Securities and Exchange Commission. Logic and data provide the basis for a positive expected value premium, offering a guide for investors targeting higher potential returns. There is pervasive historical evidence of value stocks outperforming growth stocks. Data covering nearly a century in the US, and nearly five decades of market data outside the US, support the notion that value stocks— those with lower relative prices—have higher expected returns. Recently, growth stocks have enjoyed a run of outperformance vs. their value counterparts. But while disappointing periods emerge from time to time, the principle that lower relative prices lead to higher expected returns remains the same. On average, value stocks have outperformed growth stocks by 4.54% annually in the US since 1928, as Exhibit 1 shows. Some historical context is helpful in providing perspective for growth stocks’ recent outperformance. As Exhibit 1 demonstrates, realized premiums are highly volatile. While periods of underperformance are disappointing, they are also within the range of possible outcomes. We believe investors are best served by making decisions based on sound economic principles supported by a preponderance of evidence. Value investing is based on the premise that paying less for a set of future cash flows is associated with a higher expected return. That’s one of the most fundamental tenets of investing. Combined with the long series of empirical data on the value premium, our research shows that value investing continues to be a reliable way for investors to increase expected returns going forward. Exhibit 1 Value Add Yearly observations of premiums: value minus growth in US markets, 1928-2019 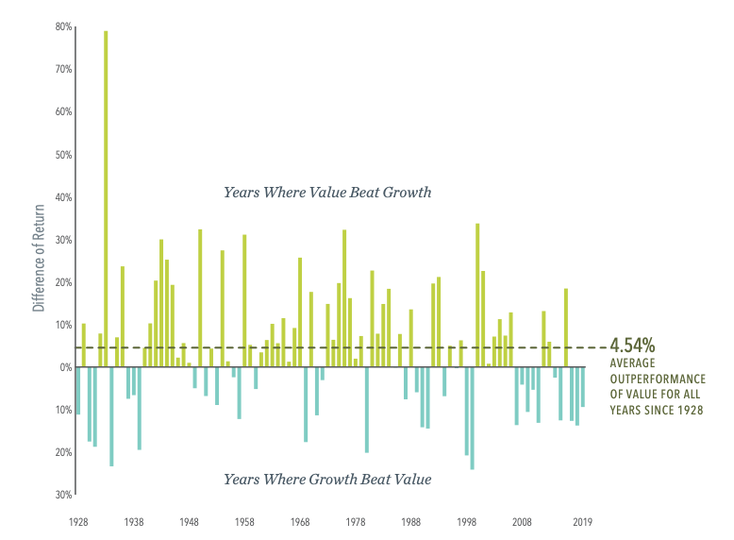 Past performance is no guarantee of future results. Investing risks include loss of principal and fluctuating value. There is no guarantee an investment strategy will be successful. Indices are not available for direct investment. Their performance does not reflect the expenses associated with the management of an actual portfolio. In US dollars. Yearly premiums are calculated as the difference in one-year returns between the two indices described. Value minus growth: Fama/French US Value Research Index minus the Fama/French US Growth Research Index. Fama/French US Value Research Index: Provided by Fama/French from CRSP securities data. Includes the lower 30% in price-to-book of NYSE securities (plus NYSE Amex equivalents since July 1962 and Nasdaq equivalents since 1973). Fama/French US Growth Research Index: Provided by Fama/French from CRSP securities data. Includes the higher 30% in price-to-book of NYSE securities (plus NYSE Amex equivalents since July 1962 and Nasdaq equivalents since 1973).
A top-heavy stock market with the largest 10 stocks accounting for over 20% of market capitalization and a marquee technology firm perched at No. 1? This sounds like a description of the current US stock market, dominated by Apple and the other FAANG stocks,1 but it is actually a reference to 1967, when IBM represented a larger portion of the market than Apple at the end of 2019 (5.8% vs. 4.1%). As we see in Exhibit 1, it is not particularly unusual for the market to be concentrated in a handful of stocks. The combined market capitalization weight of the 10 largest stocks, just over 20% at the end of last year, has been higher in the past. Exhibit 1 Same Old Story Weight of largest stocks by market capitalization in US stock market, 1927–2019 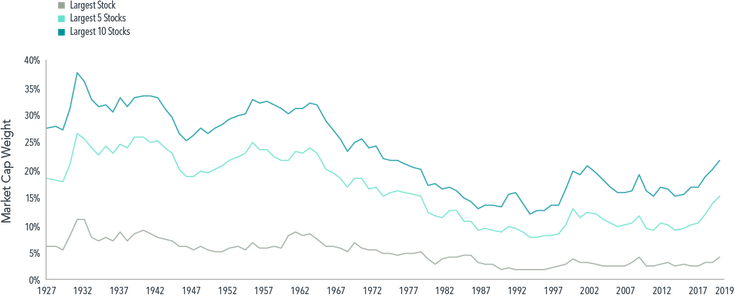 A breakdown of the largest US stocks by decade in Exhibit 2 shows some companies have stayed on top for a long time. AT&T was among the largest two for six straight decades beginning in 1930. General Motors and General Electric ranked in the top 10 at the start of multiple decades. IBM and Exxon were also mainstays in the second half of the 20th century. Hence, concentration of the stock market in a few large companies such as the FAANG stocks in recent years is not a new normal; it is old normal. Exhibit 2 Big Board Largest 10 US stocks at the start of each decade 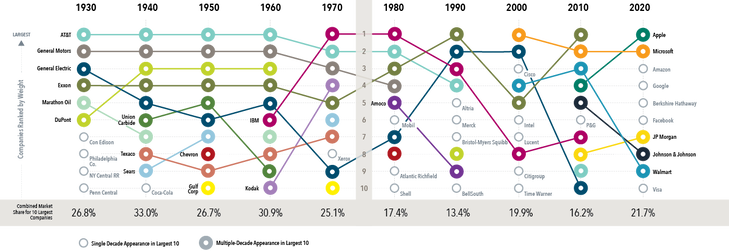 Moreover, while the definition of “high-tech” is constantly evolving, firms dominating the market have often been on the cutting edge of technology. AT&T offered the first mobile telephone service in 1946. General Motors pioneered such innovations as the electric car starter, airbags, and the automatic transmission. General Electric built upon the original Edison light bulb invention, contributing to further breakthroughs in lighting technology, such as the fluorescent bulb, halogen bulb, and the LED. So technological innovation dominating the stock market is not a new normal; it is an old normal too. Another trend attributed to a new normal is the extraordinary performance of FAANG stocks over the past decade, leading some to wonder if we should expect these stocks to continue such strong performance going forward. Investors should remember that any expectations about the future operational performance of a firm are already reflected in its current price. While positive developments for the company that exceed current expectations may lead to further appreciation of its stock price, those unexpected changes are not predictable. To this point, charting the performance of stocks following the year they joined the list of the 10 largest firms shows decidedly less stratospheric results. On average, these stocks outperformed the market by an annualized 0.7% in the subsequent three-year period. Over five- and 10-year periods, these stocks underperformed the market on average. Exhibit 3 Power Down Annualized return in excess of market for stocks after joining list of 10 largest US stocks, 1927–2019  The only constant is change, and the more things change the more they stay the same. This seems an apt description of the dominant stocks atop the market. While the types of businesses most prominent in the market vary through time, the fact that a small subset of companies’ stocks account for an outsized portion of the stock market is not new. And it remains impossible to systematically predict which large companies will outperform the stock market and which will underperform it. This underscores the importance of having a broadly diversified equity portfolio that provides exposure to a vast array of companies and sectors. GLOSSARY
1. Facebook, Amazon, Apple, Netflix, and Google (a subsidiary of Alphabet) are often referred to as the FAANG stocks. Fama/French Total US Market Research Index: The value-weighed US market index is constructed every month, using all issues listed on the NYSE, AMEX, or Nasdaq with available outstanding shares and valid prices for that month and the month before. Exclusions: American depositary receipts. Sources: CRSP for value-weighted US market return. Rebalancing: Monthly. Dividends: Reinvested in the paying company until the portfolio is rebalanced. The information in this document is provided in good faith without any warranty and is intended for the recipient’s background information only. It does not constitute investment advice, recommendation, or an offer of any services or products for sale and is not intended to provide a sufficient basis on which to make an investment decision. It is the responsibility of any persons wishing to make a purchase to inform themselves of and observe all applicable laws and regulations. Unauthorized copying, reproducing, duplicating, or transmitting of this document are strictly prohibited. Dimensional accepts no responsibility for loss arising from the use of the information contained herein. “Dimensional” refers to the Dimensional separate but affiliated entities generally, rather than to one particular entity. These entities are Dimensional Fund Advisors LP, Dimensional Fund Advisors Ltd., Dimensional Ireland Limited, DFA Australia Limited, Dimensional Fund Advisors Canada ULC, Dimensional Fund Advisors Pte. Ltd, Dimensional Japan Ltd., and Dimensional Hong Kong Limited. Dimensional Hong Kong Limited is licensed by the Securities and Futures Commission to conduct Type 1 (dealing in securities) regulated activities only and does not provide asset management services. Dimensional Fund Advisors LP is an investment advisor registered with the Securities and Exchange Commission. Same Old Story, Big Board, Power Down Charts Source: Dimensional, using data from CRSP and Compustat. Includes all US common stocks. Largest stocks identified at the end of each calendar year by sorting stocks on market capitalization. CRSP and Compustat data provided by the Center for Research in Security Prices, University of Chicago. Market is represented by the Fama/French Total US Market Research Index. Excess return for each stock is the difference in annualized compound returns between the stock and the market, computed from the first month following initial classification in the top 10. Stocks in the sample are required to have at least 36 months of returns data following classification in the top 10. Do you find it puzzling when a bleak economic report emerges from the press, only to be accompanied by a positive surge in the stock market? You’re not alone. The last few weeks have produced many examples of a stark contrast between stock market performance and economic indicators. So why the apparent disconnect? Markets are forward-looking, meaning current asset prices reflect market participants’ aggregate expectations. Those expectations include whatever future economic developments are anticipated and their potential impact on cash flows, which are key to a stock’s value. For example, if the market expects the economic environment to weaken company cash flows, stock markets may react well in advance of when we observe the impact on cash flows, as expectations are embedded in prices. And the eventual direction of the stock market will depend on how the economic outcome compares to expectations. If things aren’t as bad as expected, poor economic news can be greeted with a positive stock reaction. Looking Ahead We can see this anticipatory nature of markets in action by looking at the relation between US gross domestic product (GDP) growth and equity premiums, or stock market returns in excess of one-month US Treasury bills. When annual US equity premiums are plotted against GDP growth for the same year (top panel of Exhibit 1), there is no discernable relation between the two. Changes in GDP have not been strongly related to simultaneous stock market returns. It’s important to note that this result does not imply financial markets ignore macroeconomic data. After all, GDP encompasses several measures of the economy, not just corporate profits. However, while GDP may be an imprecise representation of the activities that ultimately drive stock prices, further analysis shows that is not the sole cause for the lack of relation between GDP growth and simultaneous equity premiums. Plotting GDP growth against the previous year’s equity premium (bottom panel of Exhibit 1) reveals a noticeable relation. The positive trend in the data suggests market prices have in fact reacted to changes in GDP but have done so in advance of these economic developments coming to fruition. This result is consistent with markets pricing in their expectation of economic growth. Exhibit 1 - Plot Development US equity premium vs. GDP growth, 1930-2019 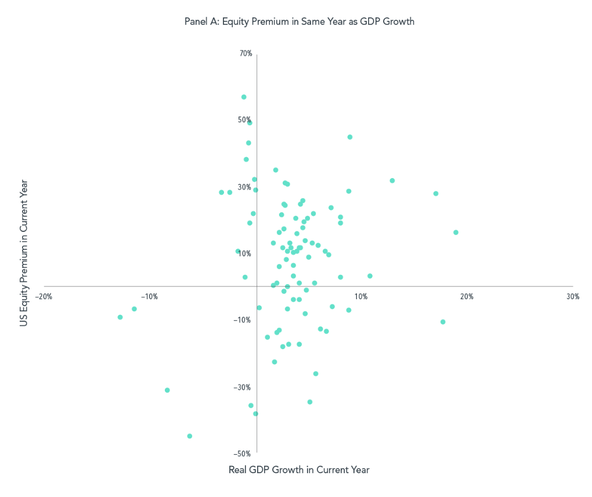 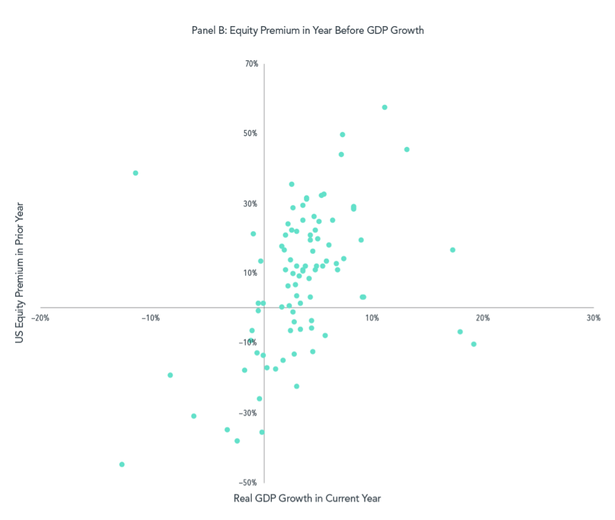 That brings us to the latest news headline worrying some investors: the eventual fallout from increasingly large US government expenditures designed to ease the economic burden of the COVID-19 pandemic. Will these efforts ultimately create a financial burden for the US government that affects future stock returns? The results in Exhibit 2 should help allay concerns over the debt level impacting equity market performance. When we sort countries each year on their debt-to-GDP for the prior year (top panel), average annual equity premiums have been slightly higher for high-debt countries than low-debt countries in both developed and emerging markets. However, the return differences’ small t-statistics—a measure of the precision of a value’s estimate – suggest these averages are not reliably different from one another.1 The top panel uses prior year debt-to-GDP data to sort countries into the high/low groups. But investors may be more focused on where they expect the debt to end up, rather than on where it’s been. In the bottom panel of Exhibit 2, we rank countries on debt-to-GDP at the end of the current year, assuming perfect foresight of end-of-year debt levels. Again, average equity premiums have been similar for high- and low-debt countries. Like the results for GDP growth, these results imply that markets have generally priced in expectations for future government debt. Exhibit 2 - Debt Defying Average equity premiums for countries sorted on debt 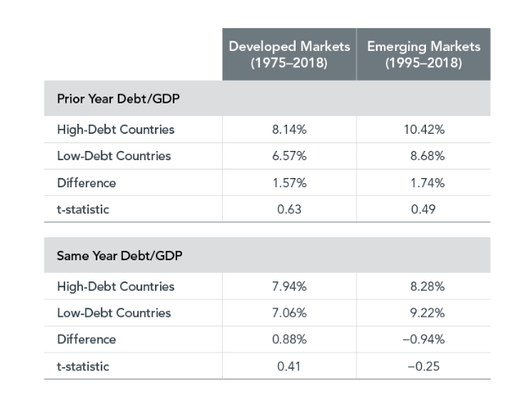 MARKETS AT WORK Macroeconomic variables and investment decisions are like frozen turkeys and deep fryers—caution should be exercised when combining the two. The results presented here are consistent with markets aggregating and processing vast sets of macroeconomic indicators and expectations for those indicators. By incorporating this information into market prices, we believe public capital markets effectively become the best available leading macroeconomic indicator. All data is from sources believed to be reliable but cannot be guaranteed or warranted. This information is intended for educational purposes, and it is not to be construed as an offer, solicitation, recommendation, or endorsement of any particular security, products, or services. No one should assume that any discussion or information contained in this material serves as a receipt of, or as a substitute for, personalized investment, tax or legal advice. Diversification does not eliminate the risk of market loss. Investment risks include loss of principal and fluctuating value. Past performance is not a guarantee of future results. Indices are not available for direct investment; therefore, their performance does not reflect the expenses associated with the management of an actual portfolio.
Appendix When Stocks and the Economy Diverge Past performance is not a guarantee of future results. Annual GDP growth rates obtained from the US Bureau of Economic Analysis. GDP growth numbers are adjusted to 2012 USD terms to remove the effects of inflation. Annual US equity premium is return difference between the Fama/French Total US Market Research Index and One-Month US Treasury Bill. Equity premium data provided by Ken French, available at mba.tuck.dartmouth.edu/pages/faculty/ken.french/data_library.html. Eugene Fama and Ken French are members of the Board of Directors of the general partner of, and provide consulting services to, Dimensional Fund Advisors LP. “One-Month Treasury Bills” is the IA SBBI US 30 Day TBill TR USD, provided by Ibbotson Associates via Morningstar Direct. All returns in USD. Countries are sorted at the beginning of each year. High-Debt and Low-Debt refer to countries above and below the median debt, respectively. Debt is general government debt and central government debt. Source: The International Monetary Fund. Equity market returns represented by MSCI country indices. Dimensional calculations from Bloomberg and MSCI data. Indices are not available for direct investment; therefore, their performance does not reflect the expenses associated with the management of an actual portfolio. 1. Researchers often cite a t-statistic value of 2.0 as the threshold for statistical reliability. GLOSSARY Macroeconomic data: Data used to measure the output of an economy, such as employment or production. Gross domestic product: The total value of goods and services produced by, for example, a country over a set period of time. Debt-to-GDP: The ratio of a company’s debt to its gross domestic product. Fama/French Total US Market Research Index: The value-weighed US market index is constructed every month, using all issues listed on the NYSE, AMEX, or Nasdaq with available outstanding shares and valid prices for that month and the month before. Exclusions: American depositary receipts. Sources: CRSP for value-weighted US market return. Rebalancing: Monthly. Dividends: Reinvested in the paying company until the portfolio is rebalanced. The information in this document is provided in good faith without any warranty and is intended for the recipient’s background information only. It does not constitute investment advice, recommendation, or an offer of any services or products for sale and is not intended to provide a sufficient basis on which to make an investment decision. It is the responsibility of any persons wishing to make a purchase to inform themselves of and observe all applicable laws and regulations. Unauthorized copying, reproducing, duplicating, or transmitting of this document are strictly prohibited. Dimensional accepts no responsibility for loss arising from the use of the information contained herein. “Dimensional” refers to the Dimensional separate but affiliated entities generally, rather than to one particular entity. These entities are Dimensional Fund Advisors LP, Dimensional Fund Advisors Ltd., Dimensional Ireland Limited, DFA Australia Limited, Dimensional Fund Advisors Canada ULC, Dimensional Fund Advisors Pte. Ltd, Dimensional Japan Ltd., and Dimensional Hong Kong Limited. Dimensional Hong Kong Limited is licensed by the Securities and Futures Commission to conduct Type 1 (dealing in securities) regulated activities only and does not provide asset management services. Dimensional Fund Advisors LP is an investment advisor registered with the Securities and Exchange Commission. With activity in many industries sharply curtailed in an effort to reduce the chances of spreading the coronavirus, some economists say a recession is inevitable, if one hasn’t already begun.1 From a markets perspective, we have already experienced a drop in stocks, as prices have likely incorporated the growing chance of recession. Investors may be tempted to abandon equities and go to cash because of perceptions of recessions and their impact. But across the two years that follow a recession’s onset, equities have a history of positive performance. Data covering the past century’s 15 US recessions show that investors tended to be rewarded for sticking with stocks. Exhibit 1 shows that in 11 of the 15 instances, or 73% of the time, returns on stocks were positive two years after a recession began. The annualized market return for the two years following a recession’s start averaged 7.8%. Downturns, Then Upturns Growth of wealth for the Fama/French Total US Market Research Index  Recessions understandably trigger worries over how markets might perform. But history can be a comfort for investors wondering whether now may be the time to move out of stocks. GLOSSARY
Fama/French Total US Market Research Index: The value-weighed US market index is constructed every month, using all issues listed on the NYSE, AMEX, or Nasdaq with available outstanding shares and valid prices for that month and the month before. Exclusions: American Depositary Receipts. Sources: CRSP for value-weighted US market return. Rebalancing: Monthly. Dividends: Reinvested in the paying company until the portfolio is rebalanced. FOOTNOTES 1Nelson D. Schwartz, “Coronavirus Recession Looms, Its Course ‘Unrecognizable,’” New York Times, March 21, 2020; Peter Coy, “The U.S. May Already Be in a Recession,” Bloomberg Businessweek, March 6, 2020. DISCLOSURES The information in this document is provided in good faith without any warranty and is intended for the recipient’s background information only. It does not constitute investment advice, recommendation, or an offer of any services or products for sale and is not intended to provide a sufficient basis on which to make an investment decision. It is the responsibility of any persons wishing to make a purchase to inform themselves of and observe all applicable laws and regulations. Unauthorized copying, reproducing, duplicating, or transmitting of this document are strictly prohibited. Dimensional accepts no responsibility for loss arising from the use of the information contained herein. Past performance, including hypothetical performance, is not a guarantee of future results. Over the past few weeks we've witnessed the global market reaction to uncertainty surrounding the coronavirus. The environment remains fluid with strongly positive and negative movements based on the latest developments. The situation can be unsettling both on a human level and from the perspective of how markets respond. The question is, what historical evidence do we have to provide rational guidance during times like these? At WealthShape, it is a fundamental principle that markets are designed to handle uncertainty, processing information in real-time as it becomes available. We see this happening when markets decline sharply, as they have recently, as well as when they rise. Such declines can be distressing to any investor, but they are also a demonstration that the market is functioning as we would expect. Market declines can occur when investors are forced to reassess expectations for the future. The expansion of the outbreak is causing worry among governments, companies, and individuals about the impact on the global economy. Apple announced earlier this month that it expected revenue to take a hit from problems making and selling products in China1. Australia’s prime minister has said the virus will likely become a global pandemic2, and other officials there warned of a serious blow to the country’s economy3. Airlines are preparing for the toll it will take on travel4. And these are just a few examples of how the impact of the coronavirus is being assessed. Growth of $1 During Outbreaks S&P 500 Composite Index 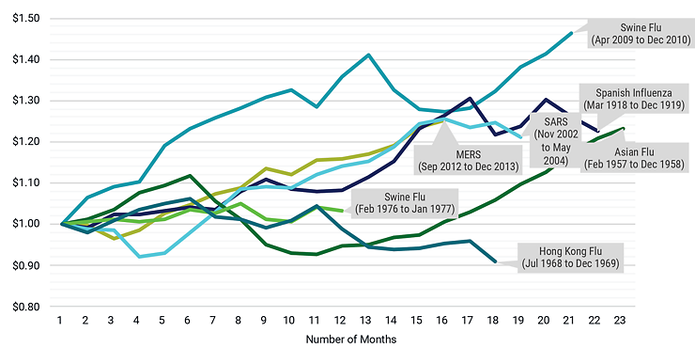 Sources: Robert Shiller Data Collection at Yale University and Centers for Disease Control and Prevention. S&P 500® Composite Index does not include reinvested dividends. We plot the growth of $1 for the S&P 500® Composite Index in the months following the first reported cases of several outbreaks throughout history and show the ending value when the outbreak subsided. There is much uncertainty associated in determining the measurement periods and precise length of each outbreak. It’s impossible to disentangle the market effects of the outbreak itself from other economic forces. The sell-off across stock markets in recent days was attributed to fears surrounding the impact of the coronavirus but happens to coincide with valuation ratios on the high side relative to historical averages for equities. The market is clearly responding to new information as it becomes known, but the market is pricing in unknowns, too. As risk increases during a time of heightened uncertainty, so do the returns investors demand for bearing that risk, which pushes prices lower. We can’t tell you when things will turn or by how much, but our expectation is that bearing today’s risk will be compensated with positive expected returns. That’s been a lesson of past health crises, such as the Ebola and swine-flu outbreaks earlier this century, and of market disruptions, such as the global financial crisis of 2008–2009. Additionally, history has shown no reliable way to identify a market peak or bottom. These beliefs argue against making market moves based on fear or speculation, even as difficult and traumatic events transpire. The Market’s Response to Crisis Performance of a Balanced Strategy: 60% Stocks, 40% Bonds Cumulative Total Return 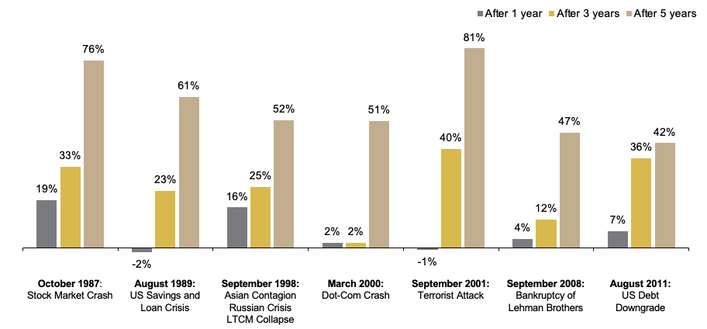 This shows the performance of a balanced investment strategy following a few historical crises. Each crisis is labeled with the month and year that it occurred or peaked. The subsequent one-, three-, and five-year annualized returns start from the first day of the month following each crisis. Although a global investment strategy would have suffered losses immediately following most of these events, the financial markets recovered over time, as indicated by the positive five-year cumulative returns. Negative events such as these may tempt investors to flee the financial markets. But diversification and a long-term perspective can help investors apply discipline to ride out the storm. Conclusion In the mind of some investors, there is always a “crisis of the day” or potential major event looming that could mean the beginning of the next drop in markets. As we know, predicting future events correctly, or how the market will react to future events, is a difficult exercise. It is important to understand, however, that market volatility is a part of investing. To enjoy the benefit of higher potential returns, investors must be willing to accept increased uncertainty. A key part of a good long-term investment experience is being able to stay with your investment philosophy, even during tough times. Financial planning combined with a well‑thought‑out, transparent investment approach can help people be better prepared to face uncertainty and improve their ability to stick with their plan and ultimately capture the long-term returns of capital markets. Amid the anxiety that accompanies developments surrounding the coronavirus, decades of financial science and long-term investing principles remain a strong guide.  Appendix
The Markets Response to Crisis In US dollars. Represents cumulative total returns of a balanced strategy invested on the first day of the following calendar month of the event noted. Balanced Strategy: 12% S&P 500 Index, 12% Dimensional US Large Cap Value Index, 6% Dow Jones US Select REIT Index, 6% Dimensional International Value Index, 6% Dimensional US Small Cap Index, 6% Dimensional US Small Cap Value Index, 3% Dimensional International Small Cap Index, 3% Dimensional International Small Cap Value Index, 2.4% Dimensional Emerging Markets Small Index, 1.8% Dimensional Emerging Markets Value Index, 1.8% Dimensional Emerging Markets Index, 10% Bloomberg Barclays Treasury Bond Index 1-5 Years, 10% FTSE World Government Bond Index 1-5 Years (hedged), 10% FTSE World Government Bond Index 1-3 Years (hedged), 10% ICE BofAML 1-Year US Treasury Note Index. Assumes monthly rebalancing. For illustrative purposes only. S&P and Dow Jones data © 2019 S&P Dow Jones Indices LLC, a division of S&P Global. All rights reserved. ICE BofAML index data © 2019 ICE Data Indices, LLC. FTSE fixed income indices © 2019 FTSE Fixed Income LLC. All rights reserved. Bloomberg Barclays data provided by Bloomberg. Dimensional indices use CRSP and Compustat data. Indices are not available for direct investment. Their performance does not reflect the expenses associated with the management of an actual portfolio. Past performance is not a guarantee of future results. Not to be construed as investment advice. Returns of model portfolios are based on back-tested model allocation mixes designed with the benefit of hindsight and do not represent actual investment performance. See “Balanced Strategy Disclosure and Index Descriptions” pages in the Appendix for additional information. 1Apple, February 17 press release https://www.apple.com/newsroom/2020/02/investor-update-on-quarterly-guidance/ 2Ben Doherty and Katharine Murphy, “Australia Declares Coronavirus Will Become a Pandemic as It Extends China Travel Ban,” The Guardian, February 27, 2020. https://www.theguardian.com/world/2020/feb/27/australia-declares-coronavirus-will-become-a-pandemic-as-it-extends-china-travel-ban 3Ben Butler, “Coronavirus Threatens Australian Economy Reeling from Drought and Fires,” The Guardian, February 5, 2020. https://www.theguardian.com/business/2020/feb/05/coronavirus-threatens-australian-economy-reeling-from-drought-and-fires; Ed Johnson, “Australia Says Economy to Take ‘Significant’ Hit from Virus,” https://www.bloomberg.com/news/articles/2020-02-05/australia-says-economy-to-take-significant-hit-from-virus 4Alistair MacDonald and William Boston, “Global Airlines Brace for Coronavirus Impact,” The Wall Street Journal, February 26, 2020.https://www.wsj.com/articles/germanys-lufthansa-makes-cuts-as-it-braces-for-coronavirus-impact-11582712819 Investors often see dividends as a way to generate income. But dividend strategies are not the only way to produce cash, and investors should be aware of the potential tradeoffs that accompany a focus on dividends. For stockholders who own dividend-paying shares, those payments arrive on a schedule (quarterly, in many cases). The cash to fund a dividend must come from somewhere, however. We know the price of a stock is potentially influenced by all expected future cash flows to shareholders. If cash is paid today in the form of a dividend, the stock price—and total market capitalization—of the issuing company may therefore fall, as the hypothetical Portfolio A in Exhibit 1 shows. That means, all else being equal, an investor who receives a dividend may also be left with a less valuable equity holding. Exhibit 1: Pay, Your Way Comparing methods of income generation 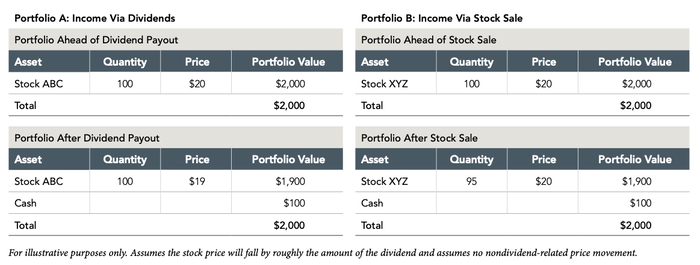 Cash Considerations An alternative method of raising cash is to simply sell shares. Exhibit 1 compares the two methods of generating income by contrasting Portfolio A with the similarly valued hypothetical Portfolio B. While Portfolio A receives income through a dividend payout, Portfolio B generates it through a stock sale. The investor in Portfolio A, in which a dividend is issued, ends up holding the same number of shares as were held prior to the dividend payout, but we assume that those shares have declined in value. The investor in Portfolio B holds a reduced number of shares that haven’t seen their value decrease as a result of a dividend payout. The two approaches arrive at the same place—both investors end up with $100 in cash and $1,900 in stock, notwithstanding potential trading costs or tax implications. But there are potential downsides to the dividend approach when contrasted with the stock-sale approach. First, the average proportion of firms paying dividends in the US was about 52% from 1963 through 2019, meaning an investor focusing only on those stocks is missing out on nearly half of investible US companies. A second consideration is that a dividend’s value, while not subject to the same degree of fluctuation as a stock price, isn’t guaranteed. Just 10 years ago, more than half of dividend-paying firms cut or eliminated those payouts following the financial crisis. More recently, a company that had consistently paid dividends for more than a century, General Electric, slashed its payout to just one cent a share, and the UK’s Vodafone Group cut its full‑year dividend for the first time in two decades. Thirdly, investors may give up flexibility in terms of the timing and the size of the payout when they rely on company-issued dividends. With stock sales, an investor determines the amount and schedule of the income. Total Return When considering an investment, it is also important to assess total return, which accounts for capital appreciation (or loss) alongside dividend income. High dividend yields may not lead to high total returns. Exhibit 2 plots the trailing 12-month returns of S&P 500 Index constituents as of December 31, 2019, with each dot representing a company. It’s clear that companies with greater dividend yields, the dots located higher up the vertical axis, weren’t consistently those with a higher total return over that period. Exhibit 2: Income Facts Dividend yields and 12-month returns for S&P 500 firms as of December 31, 2019 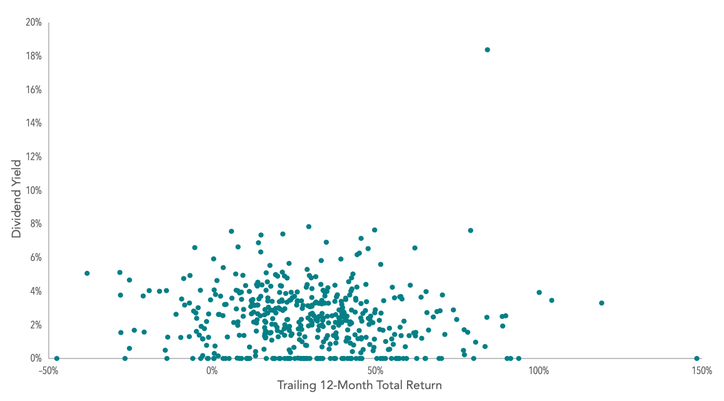 Note: Plotted yield of 18.38% reflects a stock that paid special dividends. Income generation may be a priority for some investors, but other important investment considerations, such as diversification and flexibility, needn’t fall victim to that aim. While the use of stock sales instead of dividends to create cash flow may involve trading costs and tax considerations, those concerns may be offset by the benefits of investing in companies that don’t currently pay dividends. An approach focused on income derived through dividends may not be the most desirable choice when weighing broader investment goals. All data is from sources believed to be reliable but cannot be guaranteed or warranted. This information is intended for educational purposes, and it is not to be construed as an offer, solicitation, recommendation, or endorsement of any particular security, products, or services. No one should assume that any discussion or information contained in this material serves as a receipt of, or as a substitute for, personalized investment, tax or legal advice. Diversification does not eliminate the risk of market loss. Investment risks include loss of principal and fluctuating value. Past performance is not a guarantee of future results. Indices are not available for direct investment; therefore, their performance does not reflect the expenses associated with the management of an actual portfolio.
Appendix Yield of Dreams: A Closer Look at Dividends Exhibit 2: Source: Dimensional calculations using Bloomberg data. For constituents with reported returns of less than one year, returns shown since earliest date available. S&P data © 2020 S&P Dow Jones Indices LLC, a division of S&P Global. All rights reserved. Dividend yield is calculated as the sum of dividends paid in calendar year t divided by end of year t-1 price. Note: Plotted yield of 18.38% reflects a stock that paid special dividends. FOOTNOTES 1Source: Dimensional, using data from CRSP. Stocks are sorted at the end of each June based on whether a dividend was issued in the preceding 12 months. 2Stanley Black, “Global Dividend-Paying Stocks: A Recent History” (white paper, Dimensional Fund Advisors, March 2013). 3Janet Babin, “GE cuts dividend to a penny per share. Why bother keeping it at all?” Marketplace, American Public Media, October 30, 2018. 4Adrià Calatayud, “Vodafone cuts dividend after swinging to 2019 loss.” MarketWatch, May 14, 2019. DISCLOSURES: Dimensional Fund Advisors LP is an investment advisor registered with the Securities and Exchange Commission. There is no guarantee investment strategies will be successful. Investing involves risks, including possible loss of principal. Investors should talk to their financial advisor prior to making any investment decision. Indices are not available for direct investment. Their performance does not reflect the expenses associated with the management of an actual portfolio. Past performance is no guarantee of future results. There is no guarantee an investing strategy will be successful. Investing risks include loss of principal and fluctuating value. All expressions of opinion are subject to change. This information is intended for educational purposes, and it is not to be construed as an offer, solicitation, recommendation, or endorsement of any particular security, products, or services. Imagine it is early January 2010 and you are reading a review of the financial markets. Investors have been on a roller coaster over the past three years, living through the stress of the global financial crisis and market downturn of 2008–2009, then experiencing the recovery that began in March 2009 and is still going strong. Investors who rode out the market’s slide are beginning to be rewarded. But the rebound is 10 months old, and markets have a long way to go to reach their previous highs. Opinions are mixed about what might unfold in the coming year. A December 2009 headline in the Wall Street Journal underscored the uncertainty: “Bull Market Shows Signs of Aging.”1 The publication pointed out that, although stocks have rallied and indices are on the rise, worries are mounting in some quarters that the market is running out of steam. From the vantage point of early 2010, you may be wondering whether to stick with your investment plan or move into cash and wait for more evidence that the markets have recovered. Now, fast forward to today and consider what the global equity markets delivered to investors who stayed the course. On a total return basis, global stocks more than doubled in value from 2010–2019, as Exhibit 1 shows. The MSCI All Country World IMI Index, which includes large and small cap stocks in developed and emerging markets, had a 10-year annualized return of 8.91%. From a growth-of-wealth standpoint, $10,000 invested in the stocks in the index at the beginning of 2010 would have grown to $23,473 by year-end 2019. Exhibit 1: Growth of Wealth MSCI All Country World IMI Index, January 2010–December 2019 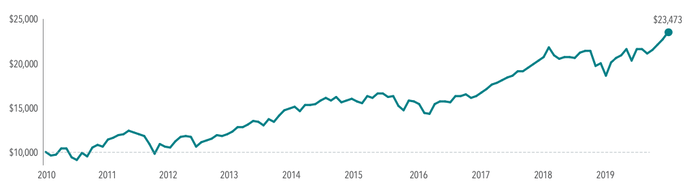 Despite positive annual market returns during most of the decade, investors had to process ever-present uncertainty arising from a host of events, including an unprecedented US credit rating downgrade, sovereign debt problems in Europe, negative interest rates, flattening yield curves, the Brexit vote, the 2016 US presidential election, recessions in Europe and Japan, slowing growth in China, trade wars, and geopolitical turmoil in the Middle East, to name a few. The decade also brought technological advances in electronic commerce and cloud computing, the global embrace of the smartphone and social media, increased automation and enhanced artificial intelligence, and new products like electric cars and early iterations of self-driving ones. Looking back, you could conclude that the decade had its share of uncertainty—just like the decades before. But overall, the US equity market experienced moderate volatility compared with previous decades. Exhibit 2 displays this by looking at returns and standard deviation, where a higher standard deviation reflects wider market swings during that decade. BENEFITS OF DIVERSIFICATION Exhibit 2: Volatility in Perspective S&P 500 Index annualized returns grouped by decade (1930–2019) 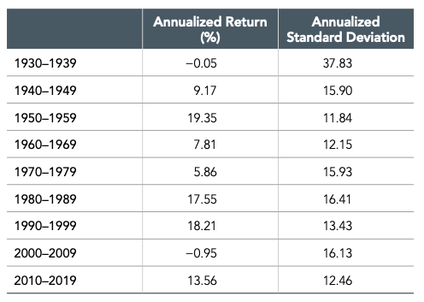 Investors who committed to global diversification and to areas of the market associated with higher returns—small cap stocks and value stocks (i.e., stocks trading at low relative prices)—were challenged over the past decade. As shown in Exhibit 3, during the 2000s, investors were generally rewarded for holding emerging markets stocks and developed ex US stocks. During the 2010s, the US market outperformed developed ex US and emerging markets. The performance of value stocks vs. growth stocks (i.e., stocks trading at high relative prices), and small vs. large cap stocks, also varied between decades. Exhibit 3: The Past Two Decades—2000s vs. 2010s Annualized returns (%) 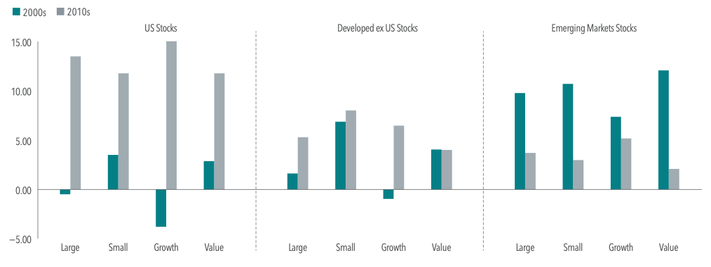 Exhibit 4: The Longer View 2000–2019: Annualized returns (%) 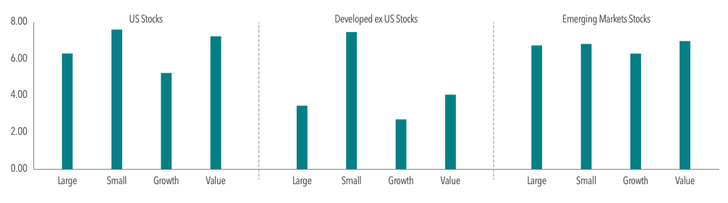 Small cap and value stocks outperformed large cap and growth stocks in the 2000s, while the 2010s produced mixed outcomes. Small caps underperformed large caps in the US and emerging markets but outperformed in the developed ex US market. Value underperformed growth in all three market regions. Despite underperforming large cap and growth in the US, small cap and value delivered 11.83% and 11.71%, respectively, for the decade. Exhibit 4 shows the cumulative investment experience over both decades, with small cap and value stocks outperforming large cap and growth stocks, respectively, across the US, developed ex US, and emerging markets. The annualized 20-year returns illustrate how diversification can help investors ride out the extremes to pursue a positive longer-term outcome. Over the past decade, global fixed income also posted returns that may have surprised some investors. In 2010, investors looking at historically low interest rates may have expected rising rates as financial markets and economies recovered from the crisis. But over the decade, short-term rates increased while long-term rates decreased. Realized term premiums were positive, as long-term bonds generally outperformed shorter-term bonds. Realized credit premiums were also positive, as lower-quality bonds generally outperformed higher-quality bonds.2 ENDURING PRINCIPLES That brings us to now—January 2020. Stocks and bonds in the US, and in many other developed markets and emerging markets, logged strong returns last year. The US bull market is 10 years old, and current headlines can give investors other reasons to worry about the future—for example, a pushback on globalization, the effects of climate change, the limits of monetary policy, the fate of Brexit, and the vagaries of the 2020 US presidential race. And those are merely the known unknowns. Looking ahead, who can say what the next 10 years will bring? The only certainty is the decade will have its own set of surprises. Here’s what we can learn from the past decade (and the ones that came before it): Despite all the change and uncertainty, the fundamentals of successful investing endured. Diversify across markets and asset groups to manage risks and pursue higher expected returns. Stay disciplined and maintain a long-term perspective. Take the daily news with a grain of salt and avoid reactive investment decisions based on fear or anxiety. Don’t try to predict future performance or time the markets. Instead, develop a sensible investment plan based on a strong philosophy—and stick with it. Investors who follow these principles can have a better financial journey in any decade. All data is from sources believed to be reliable but cannot be guaranteed or warranted. This information is intended for educational purposes, and it is not to be construed as an offer, solicitation, recommendation, or endorsement of any particular security, products, or services. No one should assume that any discussion or information contained in this material serves as a receipt of, or as a substitute for, personalized investment, tax or legal advice. Diversification does not eliminate the risk of market loss. Investment risks include loss of principal and fluctuating value. Past performance is not a guarantee of future results. Indices are not available for direct investment; therefore, their performance does not reflect the expenses associated with the management of an actual portfolio.
Appendix Exhibits 1,2 3,4 Past performance is not a guarantee of future results. Source: MSCI. In US dollars, net dividends. MSCI data © MSCI 2020, all rights reserved. Index is not available for direct investment. Performance does not reflect the expenses associated with management of an actual portfolio. S&P 500 Index data provided by Standard & Poor’s Index Services Group. Standard deviation is a statistical measurement of historical volatility. Market segment (index representation) as follows: US Stocks—Large Cap (Russell 1000 Index), Small Cap (Russell 2000 Index), Growth (Russell 3000 Growth Index), Value (Russell 3000 Value Index); Developed ex-US Stocks—Large Cap (MSCI World ex USA Index), Small Cap (MSCI World ex USA Small Cap Index), Value (MSCI World ex USA Value Index), Growth (MSCI World ex USA Growth Index); Emerging Markets Stocks—Large Cap (MSCI Emerging Markets Index), Small Cap (MSCI Emerging Markets Small Cap Index), Value (MSCI Emerging Markets Value Index), Growth (MSCI Emerging Markets Growth Index). Index returns are in US dollars, net of withholding tax on dividends. Frank Russell Company is the source and owner of the trademarks, service marks, and copyrights related to the Russell Indexes. MSCI data © MSCI 2020, all rights reserved. Indices are not available for direct investment. Index performance does not reflect the expenses associated with the management of an actual portfolio. 1. “Bull Market Shows Signs of Aging,” The Wall Street Journal, December 7, 2009. 2. Bloomberg Barclays Indices In USD. Growth stocks trade at a high price relative to a measure of fundamental value, such as book value or earnings. Value stocks trade at a low price relative to a measure of economic value, such as book value or earnings. The information in this document is provided in good faith without any warranty and is intended for the recipient’s background information only. It does not constitute investment advice, recommendation, or an offer of any services or products for sale and is not intended to provide a sufficient basis on which to make an investment decision. It is the responsibility of any persons wishing to make a purchase to inform themselves of and observe all applicable laws and regulations. Unauthorized copying, reproducing, duplicating, or transmitting of this document are strictly prohibited. Dimensional accepts no responsibility for loss arising from the use of the information contained herein. “Dimensional” refers to the Dimensional separate but affiliated entities generally, rather than to one particular entity. These entities are Dimensional Fund Advisors LP, Dimensional Fund Advisors Ltd., Dimensional Ireland Limited, DFA Australia Limited, Dimensional Fund Advisors Canada ULC, Dimensional Fund Advisors Pte. Ltd., Dimensional Japan Ltd., and Dimensional Hong Kong Limited. Dimensional Hong Kong Limited is licensed by the Securities and Futures Commission to conduct Type 1 (dealing in securities) regulated activities only and does not provide asset management services. UNITED STATES: Dimensional Fund Advisors LP is an investment advisor registered with the Securities and Exchange Commission. CANADA: January 6, 2020. These materials have been prepared by Dimensional Fund Advisors Canada ULC. Commissions, trailing commissions, management fees, and expenses all may be associated with mutual fund investments. Unless otherwise noted, any indicated total rates of return reflect the historical annual compounded total returns, including changes in share or unit value and reinvestment of all dividends or other distributions, and do not take into account sales, redemption, distribution, or optional charges or income taxes payable by any security holder that would have reduced returns. Please read the prospectus before investing. Mutual funds are not guaranteed, their values change frequently, and past performance may not be repeated. AUSTRALIA: This material is issued by DFA Australia Limited (AFS License No. 238093, ABN 46 065 937 671). This publication is provided for information only. No account has been taken of the objectives, financial situation or needs of any particular person. Accordingly, to the extent this material constitutes general financial product advice, investors should, before acting on the advice, consider the appropriateness of the advice, having regard to the investor’s objectives, financial situation and needs. Any opinions expressed in this material reflect our judgment at the date of publication and are subject to change. IF YOU ARE A RETAIL INVESTOR IN THE UK, IRELAND, GERMANY OR THE NETHERLANDS, THIS DOCUMENT HAS BEEN PROVIDED TO YOU BY YOUR FINANCIAL ADVISER, WHO CAN HELP EXPLAIN ITS CONTENTS. Neither Dimensional Ireland Limited (DIL) nor Dimensional Fund Advisors Ltd. (DFAL), as applicable (each an “Issuing Entity,” as the context requires), give financial advice. You are responsible for deciding whether an investment is suitable for your personal circumstances, and we recommend that a financial adviser helps you with that decision. NOTICE TO INVESTORS IN SWITZERLAND: This is an advertising document. WHERE ISSUED BY DIMENSIONAL IRELAND LIMITED Issued by Dimensional Ireland Limited (DIL), with registered office 10 Earlsfort Terrace, Dublin 2, D02 T380, Ireland. DIL is regulated by the Central Bank of Ireland (Registration No. C185067). Information and opinions presented in this material have been obtained or derived from sources believed by DIL to be reliable, and DIL has reasonable grounds to believe that all factual information herein is true as at the date of this document. DIL issues information and materials in English and may also issue information and materials in certain other languages. The recipient’s continued acceptance of information and materials from DIL will constitute the recipient’s consent to be provided with such information and materials, where relevant, in more than one language. WHERE ISSUED BY DIMENSIONAL FUND ADVISORS LTD. Issued by Dimensional Fund Advisors Ltd. (DFAL), 20 Triton Street, Regent’s Place, London, NW1 3BF. DFAL is authorised and regulated by the Financial Conduct Authority (FCA). Information and opinions presented in this material have been obtained or derived from sources believed by DFAL to be reliable, and DFAL has reasonable grounds to believe that all factual information herein is true as at the date of this document. DFAL issues information and materials in English and may also issue information and materials in certain other languages. The recipient’s continued acceptance of information and materials from DFAL will constitute the recipient’s consent to be provided with such information and materials, where relevant, in more than one language. RISKS Investments involve risks. The investment return and principal value of an investment may fluctuate so that an investor’s shares, when redeemed, may be worth more or less than their original value. Past performance is not a guarantee of future results. There is no guarantee strategies will be successful. Diversification neither assures a profit nor guarantees against loss in a declining market. The year 2019 served up many examples of the unpredictability of markets. Interest rates that US policy makers expected to rise fell instead. American consumers’ confidence weakened as the year began, and news headlines broadcast fears of an economic slowdown. But investors who moved onto the sidelines may have missed the gains in the US stock market. As of the end of October, the S&P 500 was up more than 20% for the year on a total-return basis. That puts it on course for the best showing since 2013 should that gain hold through December. The Greek stock market swung from a 37% decline last year to a 37% advance this year. Outside the US, Greece—the site of an economic crisis so dire some expected the country to abandon the euro earlier this decade, and a country whose equity market lost more than a third of its value last year—has had one of the most robust stock market performances among emerging economies in 2019. On top of that, Greece issued bonds at a negative nominal yield, which means investors paid for the privilege of lending the government cash. Taken as a whole, it’s a reminder that the prediction game can be a losing one for investors. Exhibit 1: Shifting Curves Yields on US Treasuries of various maturities since the end of 2018 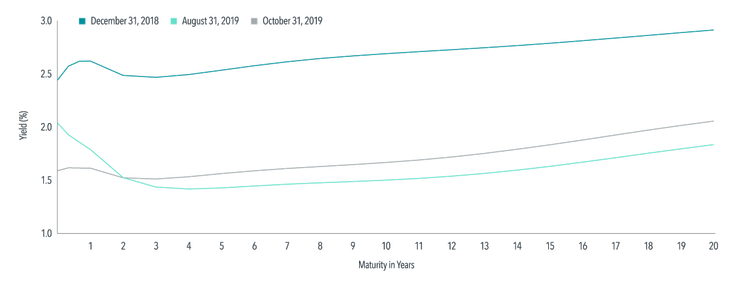 UP OR DOWN? A closer look at interest rates and the bond market shows just how unpredictable asset performance can be. Going into 2019, Federal Reserve officials expected economic conditions to support raising a key interest rate benchmark twice. Instead, policy makers lowered it three times. In the market for US Treasuries—where market participants set interest rates—the yield curve that tracks Treasuries inverted for the first time in more than 10 years, as seen in Exhibit 1. Some long-term yields fell below some short-term yields over the summer. What’s more, yields on medium- and long-term bonds were at historically low levels at the start of the year, but they fell even lower by the end of October. Investors who made moves based on the expectation yields would rise in 2019 may have been disappointed in how events ultimately transpired. Exhibit 2: Changes in the Ranks Performance of equity markets in 23 developed and 24 emerging economies 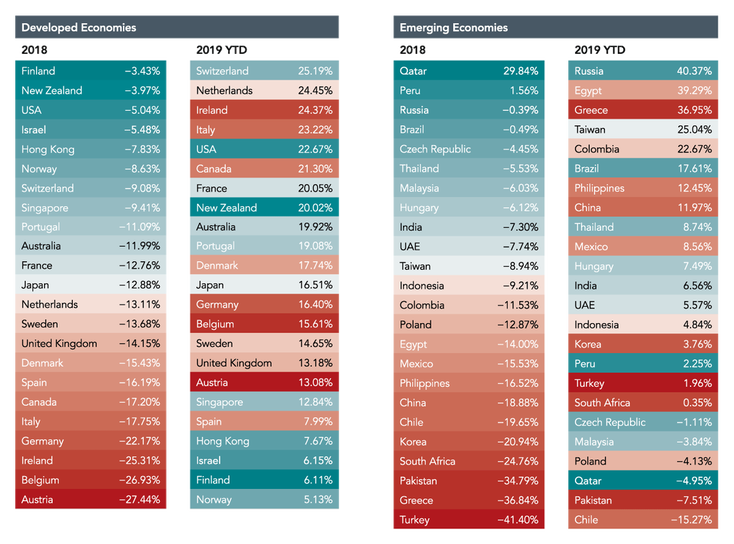 TRADING PLACES Events weren’t any easier to anticipate in the global equity markets, where no evident link appears between markets that performed well last year and those that have excelled this year, as Exhibit 2 shows. Among the 23 developed market countries, only one country was a Top 5 performer for 2018 and 2019: the US. Last year’s strongest performing market— Finland—ranked 22nd this year through the end of October. Among emerging markets, Greece swung from a 37% decline last year to a 37% advance this year through the end of October. PERENNIAL WISDOM History has shown there’s no compelling or dependable way to forecast stock and bond movements, and 2019 was a case in point. Neither the mainstream prognostications nor the hindsight of recent strong performance predicted outcomes in 2019. Rather than basing investment decisions on predictions of which way debt or equity markets are headed, a wiser strategy may be to hold a range of investments that focus on systematic and robust drivers of potential returns. Investors who were broadly diversified across asset classes and around the globe were in a position to potentially enjoy the returns that the markets delivered thus far in 2019. Last year, this year, next year—that approach is a timeless one. All data is from sources believed to be reliable but cannot be guaranteed or warranted. This information is intended for educational purposes, and it is not to be construed as an offer, solicitation, recommendation, or endorsement of any particular security, products, or services. No one should assume that any discussion or information contained in this material serves as a receipt of, or as a substitute for, personalized investment, tax or legal advice. Diversification does not eliminate the risk of market loss. Investment risks include loss of principal and fluctuating value. Past performance is not a guarantee of future results. Indices are not available for direct investment; therefore, their performance does not reflect the expenses associated with the management of an actual portfolio.
Appendix Foresight Isn't 20/20 Shifting Yield Curves: Source: ICE BofAML fair value government spot yield. ICE BofAML index data © 2019 ICE Data Indices, LLC. Changes in the Ranks: Source: MSCI country indices (net dividends) in USD for each country listed. MSCI data © MSCI 2019, all rights reserved. 2019 YTD as of 10/31/19. Note: Emerging economies do not include Argentina and Saudi Arabia, which MSCI classified as frontier and standalone, respectively, prior to May 2019. 1. Based on readings from the Conference Board Consumer Confidence Survey and the University of Michigan Index of Consumer Sentiment. 2. Markets designated as developed or emerging by MSCI. Dimensional Fund Advisors LP is an investment advisor registered with the Securities and Exchange Commission. There is no guarantee investment strategies will be successful. Investing involves risks, including possible loss of principal. Investors should talk to their financial advisor prior to making any investment decision. There is always the risk that an investor may lose money. A long-term investment approach cannot guarantee a profit. Indices are not available for direct investment. Their performance does not reflect the expenses associated with the management of an actual portfolio. Past performance is not a guarantee of future results. Diversification does not eliminate the risk of market loss. All expressions of opinion are subject to change. This information is intended for educational purposes, and it is not to be construed as an offer, solicitation, recommendation, or endorsement of any particular security, products, or services. The stocks commonly referred to by the FAANG moniker— Facebook, Amazon, Apple, Netflix, and Google (now trading as Alphabet)—have posted impressive gains through the years, with all now worth many times their initial-public-offering prices. The notion of FAANG stocks as a powerful group holding sway over the markets has sunk its teeth into some investors. But how much of the market’s recent returns are attributable to FAANG stocks? And does their performance point to a change in the markets? Exhibit 1: A Little Help from the FAANGs Annualized US market compound returns with and without Facebook, Amazon, Apple, Netflix, and Alphabet (Google), 2009–2018 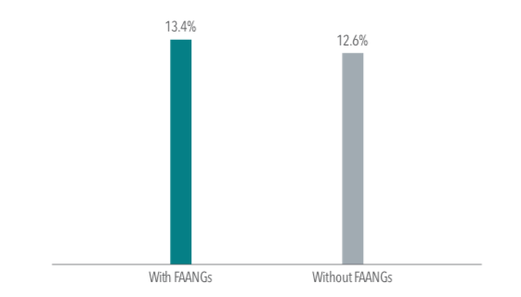 Research has shown no reliable way to predict the top‐performing stocks, arguing for diversification instead. Over the 10 years through December 31, 2018, the US broad market returned an annualized 13.4%, as shown in Exhibit 1. Excluding FAANG stocks, the market returned 12.6%. The 0.8-percentage-point bump resulted from the FAANGs collectively averaging a 30.4% yearly return over the decade. Investors may be surprised to learn that it is actually common for a subset of stocks to drive a sizable portion of the overall market return. Exhibit 2 shows that excluding the top 10% of performers each year from 1994 to 2018 would have reduced global market performance from 7.2% to 2.9%. Further excluding the best 25% of performers would have turned a positive return into a relatively large negative return. This lesson also applies to capturing the premiums associated with a company’s size and its price-to-book ratio. Research by Eugene Fama and Kenneth French (”Migration,” 2006) provides evidence that these premiums are driven in large part by a subset of stocks migrating across the market. Exhibit 2: Weighing the Impact Global stock market performance excluding top performers, 1994–2018 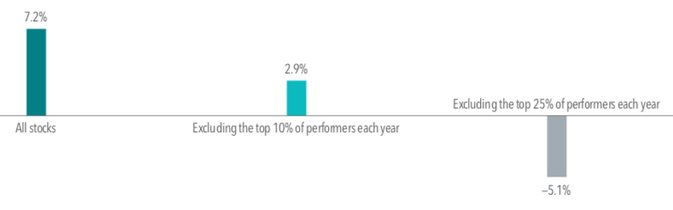 Research has shown no reliable way to predict the top-performing stocks. Looking at the top 10% of stocks by performance each year since 1994, on average less than a fifth of that group has ranked in the top 10% the following year. The tendency for strong market performance to be concentrated in a subset of stocks is therefore also a cautionary tale about the importance of diversification— investors with concentrated portfolios may actually miss out on the very stocks that deliver the best of what the market has to offer. An investment approach built around broad diversification can help achieve a more reliable outcome for investors over the long term—sharp acronym or not. All data is from sources believed to be reliable but cannot be guaranteed or warranted. This information is intended for educational purposes, and it is not to be construed as an offer, solicitation, recommendation, or endorsement of any particular security, products, or services. No one should assume that any discussion or information contained in this material serves as a receipt of, or as a substitute for, personalized investment, tax or legal advice. Diversification does not eliminate the risk of market loss. Investment risks include loss of principal and fluctuating value. Past performance is not a guarantee of future results. Indices are not available for direct investment; therefore, their performance does not reflect the expenses associated with the management of an actual portfolio.
Appendix How Markets Work and the FAANG Mentality Exhibit 1: Source: Dimensional using data from the Center for Research in Security Prices (CRSP) covering the 10 calendar years since the financial crisis. With FAANGs portfolio formed each month including common stocks listed on NYSE, NYSE MKT, and NASDAQ. Stocks are weighted by market capitalization. Without FAANGs formed similarly but excluding Facebook, Apple, Amazon, Netflix, and Alphabet (Google). Past performance is no guarantee of future results. Exhibit 2: “All stocks” includes all eligible stocks in all eligible developed and emerging markets at their market cap weights. Eligible stocks are required to meet a minimum market capitalization requirement. REITs and investment companies are excluded. Compound average annual returns are computed as the compound returns of the value-weighted averages of the annual returns of the included securities. “Excluding the top 10%” and “Excluding the top 25%” are constructed similarly but exclude the respective percentages of stocks with the highest annual returns by security count each year. Individual security data are obtained from Bloomberg, London Share Price Database, and Centre for Research in Finance. The eligible countries are: Australia, Austria, Belgium, Brazil, Canada, Chile, China, Colombia, Czech Republic, Denmark, Egypt, Finland, France, Germany, Greece, Hong Kong, Hungary, India, Indonesia, Ireland, Israel, Italy, Japan, Republic of Korea, Malaysia, Mexico, Netherlands, New Zealand, Norway, Peru, Philippines, Poland, Portugal, Russia, Singapore, South Africa, Spain, Sweden, Switzerland, Taiwan, Thailand, Turkey, the UK, and US. Diversification does not eliminate the risk of market loss. Past performance is no guarantee of future results. 1. With-FAANGs portfolio formed each month including common stocks listed on NYSE, NYSE MKT, and NASDAQ. Stocks are weighted by market capitalization. Without-FAANGs formed similarly but excluding Facebook, Apple, Amazon, Netflix, and Alphabet (Google). Source: Dimensional using data from CRSP. 2. The onset of broad coverage of all-cap stock data across developed and emerging markets. 3. All eligible common stocks in all eligible developed and emerging markets, ranked by total return. Source: Dimensional, using data from Bloomberg LP. Dimensional Fund Advisors LP is an investment advisor registered with the Securities and Exchange Commission. There is no guarantee investment strategies will be successful. Investing involves risks, including possible loss of principal. Investors should talk to their financial advisor prior to making any investment decision. There is always the risk that an investor may lose money. A long-term investment approach cannot guarantee a profit. Indices are not available for direct investment. Their performance does not reflect the expenses associated with the management of an actual portfolio. Past performance is not a guarantee of future results. Diversification does not eliminate the risk of market loss. All expressions of opinion are subject to change. This information is intended for educational purposes, and it is not to be construed as an offer, solicitation, recommendation, or endorsement of any particular security, products, or services. The first decade of the 21st century, and the second one that’s drawing to a close, have reinforced for investors some timeless market lessons: Returns can vary sharply from one period to another. Holding a broadly diversified portfolio can help smooth out the swings. And focusing on known drivers of higher expected returns can increase the potential for long‐term success. Having a sound strategy built on those principles - and sticking to it through good times and bad - can be a rewarding investment approach. “THE LOST DECADE”? Looking at a broad measure of the US stock market, such as the S&P 500, over the past 20 years, you could be forgiven for thinking of Charles Dickens: It was the best of times and the worst of times (see Exhibit 1). For US large cap stocks, the worst came first. The “lost decade” from January 2000 through December 2009 resulted in disappointing returns for many who were invested in the securities in the S&P 500. An index that had averaged more than 10% annualized returns before 2000 instead delivered less‐than‐average returns from the start of the decade to the end. Annualized returns for the S&P 500 during that market period were −0.95%. 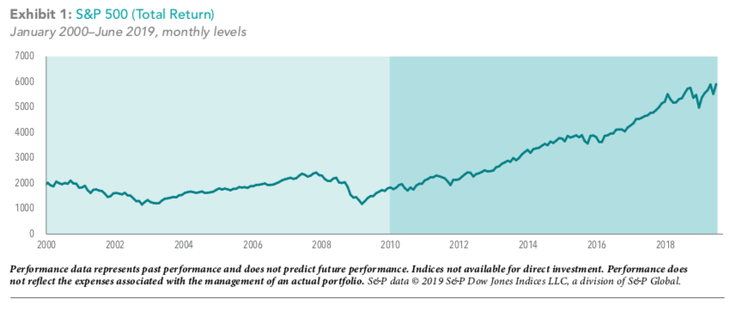 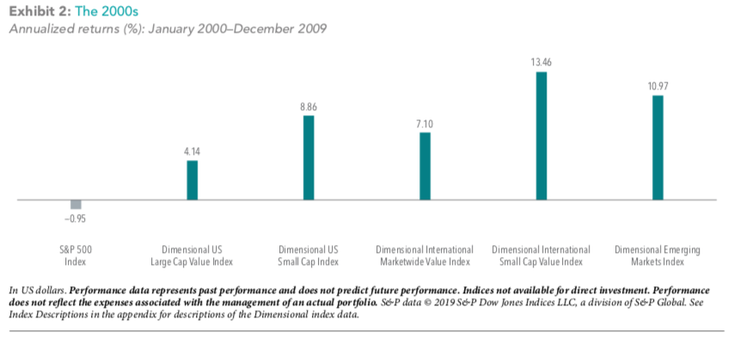 Yet it was a good decade for investors who diversified their holdings globally beyond US large cap stocks and included other parts of the market with higher expected returns—companies with small market capitalizations or low relative price (value stocks). As Exhibit 2 shows, a range of indices across many other parts of the global market outperformed the S&P 500 during that time span. FLIPPING THE SCRIPT The next period of nine‐plus years reveals quite a different story. It has looked more like best of times for the S&P 500, as the index, when viewed by total return, has more than tripled since the start of the decade in the bounce‐back from the global financial crisis. US large cap growth stocks have been some of the brightest stars during this span. Accordingly, from 2010 through the first half of 2019, many parts of the market that performed well during the previous decade haven’t been able to outperform the S&P 500, as Exhibit 3 displays. Since many of these asset classes haven’t kept pace with the S&P, these returns might cause some to question their allocation to the asset classes that drove positive returns during the 2000s. 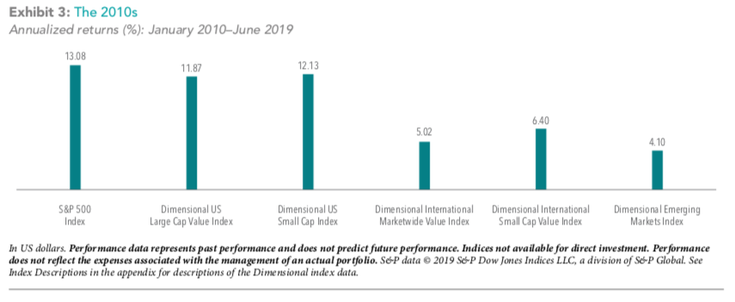 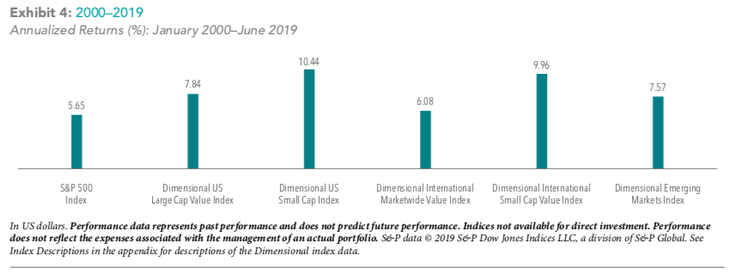 THE CASE FOR GREAT EXPECTATIONS It’s been stated many times that investors may want to take a long‐term perspective toward investing, and the performance of stock markets since 2000 supports this point of view. Over the past 19 1⁄2 years (see Exhibit 4), investing outside the US presented investors with opportunities to capture annualized returns that surpassed the S&P 500’s 5.65%, despite periods of underperformance, including the most recent nine‐plus years. Cumulative performance from 2000 through June 2019 also reflects the benefits of having a diversified portfolio that targets areas of the market with higher expected returns, such as small and value stocks. And it underscores the principle that longer time frames increase the likelihood of having a good investment experience. No one knows what the next 10 months will bring, much less the next 10 years. But maintaining patience and discipline, through the bad times and the good, puts investors in position to increase the likelihood of long‐term success. APPENDIX: Index Descriptions
Dimensional US Large Cap Value Index is compiled by Dimensional from CRSP and Compustat data. Targets securities of US companies traded on the NYSE, NYSE MKT (formerly AMEX), and Nasdaq Global Market with market capitalizations above the 1,000th-largest company whose relative price is in the bottom 30% of the Dimensional US Large Cap Index after the exclusion of utilities, companies lacking financial data, and companies with negative relative price. The index emphasizes securities with higher profitability, lower relative price, and lower market capitalization. Profitability is measured as operating income before depreciation and amortization minus interest expense scaled by book. Exclusions: non-US companies, REITs, UITs, and investment companies. The index has been retroactively calculated by Dimensional and did not exist prior to March 2007. The calculation methodology for the Dimensional US Large Cap Value Index was amended in January 2014 to include direct profitability as a factor in selecting securities for inclusion in the index. Prior to January 1975: Targets securities of US companies traded on the NYSE, NYSE MKT (formerly AMEX), and Nasdaq Global Market with market capitalizations above the 1,000th-largest company whose relative price is in the bottom 20% of the Dimensional US Large Cap Index after the exclusion of utilities, companies lacking financial data, and companies with negative relative price. Dimensional US Small Cap Index is compiled by Dimensional from CRSP and Compustat data. Targets securities of US companies traded on the NYSE, NYSE MKT (formerly AMEX), and Nasdaq Global Market whose market capitalization falls in the lowest 8% of the total market capitalization of the eligible market. The index emphasizes companies with higher profitability. Profitability is measured as operating income before depreciation and amortization minus interest expense scaled by book. Exclusions: non-US companies, REITs, UITs, and investment companies. The index has been retroactively calculated by Dimensional and did not exist prior to March 2007. The calculation methodology for the Dimensional US Small Cap Index was amended in January 2014 to include direct profitability as a factor in selecting securities for inclusion in the index. Prior to January 1975: Targets securities of US companies traded on the NYSE, NYSE MKT (formerly AMEX), and Nasdaq Global Market whose market capitalization falls in the lowest 8% of the total market capitalization of the eligible market. Dimensional International Marketwide Value Index is compiled by Dimensional from Bloomberg securities data. The index consists of companies whose relative price is in the bottom 33% of their country’s companies after the exclusion of utilities and companies with either negative or missing relative price data. The index emphasizes companies with smaller capitalization, lower relative price, and higher profitability. The index also excludes those companies with the lowest profitability and highest relative price within their country’s value universe. Profitability is measured as operating income before depreciation and amortization minus interest expense scaled by book. Exclusions: REITs and investment companies. The index has been retroactively calculated by Dimensional and did not exist prior to April 2008. The calculation methodology for the Dimensional International Marketwide Value Index was amended in January 2014 to include direct profitability as a factor in selecting securities for inclusion in the index. Dimensional International Small Cap Value Index is defined as companies whose relative price is in the bottom 35% of their country’s respective constituents in the Dimensional International Small Cap Index after the exclusion of utilities and companies with either negative or missing relative price data. The index also excludes those companies with the lowest profitability within their country’s small value universe. Profitability is measured as operating income before depreciation and amortization minus interest expense scaled by book. Exclusions: REITs and investment companies. The index has been retroactively calculated by Dimensional and did not exist prior to April 2008. The calculation methodology for the Dimensional International Small Cap Value Index was amended in January 2014 to include direct profitability as a factor in selecting securities for inclusion in the index. Prior to January 1990: Created by Dimensional, the index includes securities of MSCI EAFE countries in the top 30% of book-to-market by market capitalization conditional on the securities being in the bottom 10% of market capitalization, excluding the bottom 1%. All securities are market capitalization weighted. Each country is capped at 50%; rebalanced semiannually. Dimensional Emerging Markets Index is compiled by Dimensional from Bloomberg securities data. Market capitalization-weighted index of all securities in the eligible markets. The index has been retroactively calculated by Dimensional and did not exist prior to April 2008. Exclusions: REITs and investment companies. Dimensional Fund Advisors LP is an investment advisor registered with the Securities and Exchange Commission.There is no guarantee investment strategies will be successful. Investing involves risks, including possible loss of principal. Investors should talk to their financial advisor prior to making any investment decision. There is always the risk that an investor may lose money. A long-term investment approach cannot guarantee a profit. Indices are not available for direct investment. Their performance does not reflect the expenses associated with the management of an actual portfolio. Past performance is not a guarantee of future results. Diversification does not eliminate the risk of market loss. All expressions of opinion are subject to change. This information is intended for educational purposes, and it is not to be construed as an offer, solicitation, recommendation, or endorsement of any particular security, products, or services. Over the course of a summer, it’s not unusual for the stock market to be a topic of conversation at barbecues or other social gatherings. A neighbor or relative might ask about which investments are good at the moment. The lure of getting in at the right time or avoiding the next downturn may tempt even disciplined, long-term investors. The reality of successfully timing markets, however, isn’t as straightforward as it sounds. OUTGUESSING THE MARKET IS DIFFICULT Attempting to buy individual stocks or make tactical asset allocation changes at exactly the “right” time presents investors with substantial challenges. First and foremost, markets are fiercely competitive and adept at processing information. During 2018, a daily average of $462.8 billion in equity trading took place around the world.1 The combined effect of all this buying and selling is that available information, from economic data to investor preferences and so on, is quickly incorporated into market prices. Trying to time the market based on an article from this morning’s newspaper or a segment from financial television? It’s likely that information is already reflected in prices by the time an investor can react to it. Dimensional recently studied the performance of actively managed mutual funds and found that even professional investors have difficulty beating the market: over the last 20 years, 77% of equity funds and 92% of fixed income funds failed to survive and outperform their benchmarks after costs.2 Attempting to buy individual stocks or make tactical asset allocation changes at exactly the “right” time presents investors with substantial challenges. Further complicating matters, for investors to have a shot at successfully timing the market, they must make the call to buy or sell stocks correctly not just once, but twice. Professor Robert Merton, a Nobel laureate, said it well in a recent interview with Dimensional: “Timing markets is the dream of everybody. Suppose I could verify that I’m a .700 hitter in calling market turns. That’s pretty good; you’d hire me right away. But to be a good market timer, you’ve got to do it twice. What if the chances of me getting it right were independent each time? They’re not. But if they were, that’s 0.7 times 0.7. That’s less than 50-50. So, market timing is horribly difficult to do.” Exhibit 1: Average Annualized Returns After New Market Highs S&P 500, January 1926–December 2018 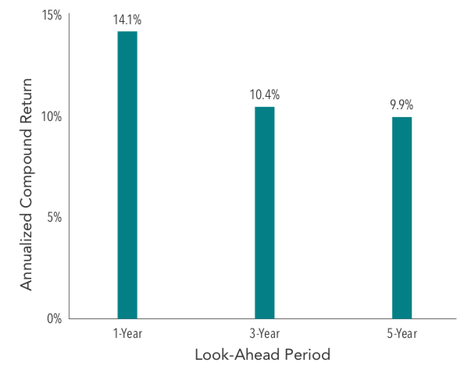 TIME AND THE MARKET The S&P 500 Index has logged an incredible decade. Should this result impact investors’ allocations to equities? Exhibit 1 suggests that new market highs have not been a harbinger of negative returns to come. The S&P 500 went on to provide positive average annualized returns over one, three, and five years following new market highs. CONCLUSION Outguessing markets is more difficult than many investors might think. While favorable timing is theoretically possible, there isn’t much evidence that it can be done reliably, even by professional investors. The positive news is that investors don’t need to be able to time markets to have a good investment experience. Over time, capital markets have rewarded investors who have taken a long-term perspective and remained disciplined in the face of short-term noise. By focusing on the things they can control (like having an appropriate asset allocation, diversification, and managing expenses, turnover, and taxes) investors can better position themselves to make the most of what capital markets have to offer. Appendix
Average Annualized Returns After New Market Highs: In US dollars. Past performance is no guarantee of future results. New market highs are defined as months ending with the market above all previous levels for the sample period. Annualized compound returns are computed for the relevant time periods subsequent to new market highs and averaged across all new market high observations. There were 1,115 observation months in the sample. January 1990–present: S&P 500 Total Returns Index. S&P data © 2019 S&P Dow Jones Indices LLC, a division of S&P Global. All rights reserved. January 1926– December 1989; S&P 500 Total Return Index, Stocks, Bonds, Bills and Inflation YearbookTM, Ibbotson Associates, Chicago. For illustrative purposes only. Index is not available for direct investment; therefore, its performance does not reflect the expenses associated with the management of an actual portfolio. There is always a risk that an investor may lose money. 1. In US dollars. Source: Dimensional, using data from Bloomberg LP. Includes primary and secondary exchange trading volume globally for equities. ETFs and funds are excluded. Daily averages were computed by calculating the trading volume of each stock daily as the closing price multiplied by shares traded that day. All such trading volume is summed up and divided by 252 as an approximate number of annual trading days. 2. Mutual Fund Landscape 2019. Dimensional Fund Advisors LP is an investment advisor registered with the Securities and Exchange Commission. Indices are not available for direct investment. Their performance does not reflect the expenses associated with the management of an actual portfolio. Past performance is not a guarantee of future results. Diversification does not eliminate the risk of market loss. There is no guarantee investment strategies will be successful. Investing involves risks, including possible loss of principal. Investors should talk to their financial advisor prior to making any investment decision. There is always the risk that an investor may lose money. A long-term investment approach cannot guarantee a profit. All expressions of opinion are subject to change. This article is distributed for informational purposes, and it is not to be construed as an offer, solicitation, recommendation, or endorsement of any particular security, products, or services. Robert Merton provides consulting services to Dimensional Fund Advisors LP. “I knew the market was going to crash.” It’s a common investment expression that you’ve likely heard plenty of times. However, is there any reason to take such statements seriously? Hindsight bias has been deceiving investors for years. Once we’ve had time to digest information, it can often seem like yesterday’s news should have been more predictable. Perhaps the best way to avoid behavioral hazards is to first acknowledge that they exist. Recognizing what we really know versus what’s unknowable may be the single most important investment decision we ever make. 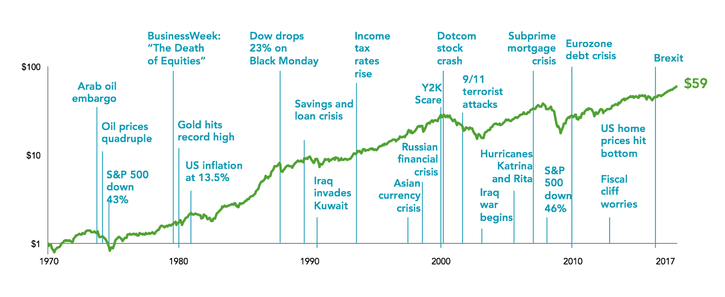 The history of stock markets is filled with ups and downs which after the fact appear to be easily identified. The huge leverage risk-taking by banking/investment and insurance firms leading up to the 2008 financial crisis is blatantly visible today. We’ve had the benefit of 10 years to reflect. Nobel prize-winning psychologist, Daniel Kahneman would say, it’s during this time of careful observation that hindsight creates an illusion of understanding. Essentially our brains screw up the timeline. Signs of danger appear more obvious after the fact than they were in real time. In 2008, a variety of dominoes had to fall on the way to peak awareness. When it became evident that the housing market was bolstered by bad loans with roots extending across the financial spectrum, markets reacted exactly as they should. They priced in the new information and the results were painful. Investing in 20/20 hindsight can lead to an even more detrimental exercise in creating a misconception that future events are coming based on information that is wholly unknowable. This is evidenced by an unending flow of soothsaying from financial media outlets. A few examples: October 20th 1987 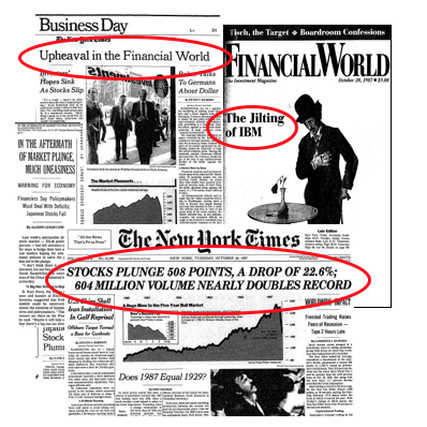 One Day later: October 21st 1987 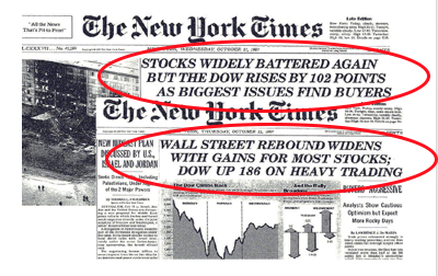 One of the single best days in market history was October 21, 1987, only two days after the Black Monday market crash. The S&P 500 was up 9.10%
So much time and energy focuses on things that are unknowable in the moment. News by definition is unpredictable. Therefore, any action taken as an investor must answer the following: “What are the chances that I know something that everyone else doesn’t? Furthermore, even if I do know something, how long will I be the only one? And finally, what are the chances that my information has already been incorporated into current market values?” Today we carry more computing power in our pockets than all of NASA did when it put the first men on the moon in 1969. Needless to say, news travels at an incredible speed. By the time it reaches you and me, it’s almost a certainty that markets have already incorporated the latest news into prices. This simple fact demonstrates the value or lack thereof for opinions based on past events. Investors should remain conscious of the brain’s tendency to value “known information” as if it were “unknown.” By doing so, we can better combat the impacts of hindsight decision making. What’s an investor to do? It’s folly to suggest in retrospect that market prices were wrong because they were never perfect in the first place. Their primary role is to provide the best representation of all available information at the moment. It’s a far better exercise to follow the preponderance of evidence we know exists. Markets tend to be resilient to crisis over the long term and investors have historically been rewarded for maintaining behavioral discipline. Therefore, an accurate forecast of future events isn't a prerequisite for success. The Market’s Response to Crisis Performance of a Balanced Strategy: 60% Stocks, 40% Bonds (Cumulative Total Return) 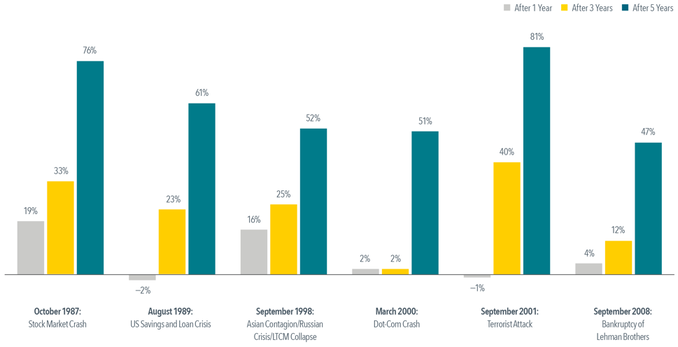 In US dollars. Represents cumulative total returns of a balanced strategy invested on the first day of the following calendar month of the event noted. Balanced Strategy: 12% S&P 500 Index,12% Dimensional US Large Cap Value Index, 6% Dow Jones US Select REIT Index, 6% Dimensional International Marketwide Value Index, 6% Dimensional US Small Cap Index, 6% Dimensional US Small Cap Value Index, 3% Dimensional International Small Cap Index, 3% Dimensional International Small Cap Value Index, 2.4% Dimensional Emerging Markets Small Index, 1.8% Dimensional Emerging Markets Value Index, 1.8% Dimensional Emerging Markets Index, 10% Bloomberg Barclays Treasury Bond Index 1-5 Years, 10% Citigroup World Government Bond Index 1-5 Years (hedged), 10% Citigroup World Government Bond Index 1-3 Years (hedged), 10% BofA Merrill Lynch 1-Year US Treasury Note Index. The S&P data are provided by Standard & Poor’s Index Services Group. The Merrill Lynch Indices are used with permission; copyright 2017 Merrill Lynch, Pierce, Fenner & Smith Incorporated; all rights reserved. Citigroup Indices used with permission, © 2017 by Citigroup. Bloomberg Barclays data provided by Bloomberg. For illustrative purposes only. Dimensional indices use CRSP and Compustat data. Indices are not available for direct investment. Their performance does not reflect the expenses associated with the management of an actual portfolio. Past performance is not a guarantee of future results. Not to be construed as investment advice. Rebalanced monthly. Returns of model portfolios are based on back-tested model allocation mixes designed with the benefit of hindsight and do not represent actual investment performance. All data is from sources believed to be reliable but cannot be guaranteed or warranted. This information is intended for educational purposes, and it is not to be construed as an offer, solicitation, recommendation, or endorsement of any particular security, products, or services. No one should assume that any discussion or information contained in this material serves as a receipt of, or as a substitute for, personalized investment, tax or legal advice. Diversification does not eliminate the risk of market loss. Investment risks include loss of principal and fluctuating value. Past performance is not a guarantee of future results. Indices are not available for direct investment; therefore, their performance does not reflect the expenses associated with the management of an actual portfolio.
The Market Response to Crisis Source: Dimensional Fund Advisors LP. Past performance is no guarantee of future results. There is no guarantee an investing strategy will be successful. Investing involves risks including possible loss of principal. Diversification does not eliminate the risk of market loss. Indices are not available for direct investment. Their performance does not reflect the expenses associated with the management of an actual portfolio. All expressions of opinion are subject to change. This article is distributed for informational purposes, and it is not to be construed as an offer, solicitation, recommendation, or endorsement of any particular security, products, or services. Investors should talk to their financial advisor prior to making any investment decision. Eugene Fama and Ken French are members of the Board of Directors of the general partner of, and provide consulting services to, Dimensional Fund Advisors LP. |

|
Phone: 860-837-0303
|
Message: [email protected]
|
|
WINDSOR
360 Bloomfield Ave 3rd Floor Windsor, CT 06095 |
WEST HARTFORD
15 N Main St #100 West Hartford, CT 06107 |
SHELTON
One Reservoir Corporate Centre 4 Research Dr - Suite 402 Shelton, CT 06484 |
ROCKY HILL
175 Capital Boulevard 4th Floor Rocky Hill, CT 06067 |
Home I Who We Are I How We Invest I Portfolios I Financial Planning I Financial Tools I Wealth Management I Retirement Plan Services I Blog I Contact I FAQ I Log In I Privacy Policy I Regulatory & Disclosures

|

|

|
|

|

|

|
© 2024 WealthShape. All rights reserved.