
|
Over the last several years, index funds have received increased attention from investors and the financial media. Some have even made claims that the increased usage of index funds may be distorting market prices. For many, this argument hinges on the premise that indexing reduces the efficacy of price discovery. If index funds are becoming increasingly popular and investors are “blindly” buying an index’s underlying holdings, sufficient price discovery may not be happening in the market. But should the rise of index funds be a cause of concern for investors? Using data and reasoning, we can examine this assertion and help investors understand that markets continue to work, and investors can still rely on market prices despite the increased prevalence of indexing. Many buyers and sellers While the popularity of indexing has been increasing over time, index fund investors still make up a relatively small percentage of overall investors. For example, data from the Investment Company Institute shows that as of December 2017, 35% of total net assets in US mutual funds and ETFs were held by index funds, compared to 15% in December of 2007. Nevertheless, the majority of total fund assets (65%) were still managed by active mutual funds in 2017. As a percentage of total market value, index-based mutual funds and ETFs also remain relatively small. As shown in Exhibit 1, domestic index mutual funds and ETFs comprised only 13% of total US stock market capitalization in 2017. Exhibit 1. Investor Breakdown in the US Stock Market as a Percentage of Total US Stock Market Capitalization  All totals may not equal 100% due to rounding. Sourced from the 2018 ICI Fact Book: ici.org/pdf/2018_factbook.pdf In this context, it should also be noted that many investors use nominally passive vehicles, such as ETFs, to engage in traditionally active trading. For example, while both a value index ETF and growth index ETF may be classified as index investments, investors may actively trade between these funds based on short-term expectations, needs, circumstances, or for other reasons. In fact, several index ETFs regularly rank among the most actively traded securities in the market. Beyond mutual funds, there are many other participants in financial markets, including individual security buyers and sellers, such as actively managed pension funds, hedge funds, and insurance companies, just to name a few. Security prices reflect the viewpoints of all these investors, not just the population of mutual funds. As Professors Eugene Fama and Kenneth French point out in their blog post titled “Q&A: What if Everybody Indexed?”, the impact of an increase in indexed assets also depends to some extent on which market participants switch to indexing: “If misinformed and uninformed active investors (who make prices less efficient) turn passive, the efficiency of prices improves. If some informed active investors turn passive, prices tend to become less efficient. But the effect can be small if there is sufficient competition among remaining informed active investors. The answer also depends on the costs of uncovering and evaluating relevant knowable information. If the costs are low, then not much active investing is needed to get efficient prices.” What’s the volume? Trade volume data are another place to look for evidence of well-functioning markets. Exhibit 2 shows that despite the increased prevalence of index funds, annual equity market trading volumes have remained at similar levels over the past 10 years. This indicates that markets continue to facilitate price discovery at a large scale. Exhibit 2. Annual Global Equity Market Trading Volume, 2007–2018 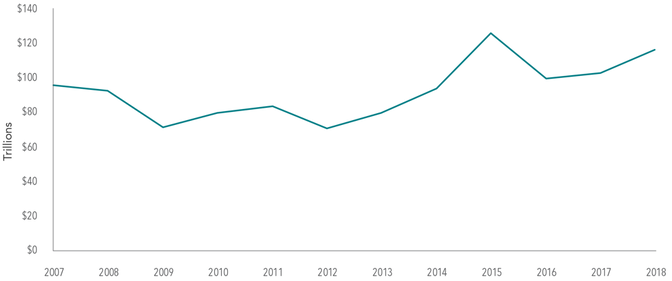 In US dollars. Source: Dimensional, using data from Bloomberg LP. Includes primary and secondary exchange trading volume globally for equities. ETFs and funds are excluded. Besides secondary market trading, there are also other paths to price discovery through which new information can get incorporated into market prices. For example, companies themselves can impact prices by issuing stock and repurchasing shares. In 2018 alone, there were 1,633 initial public offerings, 3,492 seasoned equity offerings, and 4,148 buybacks around the world.3 The derivatives markets also help incorporate new information into market prices as the prices of those financial instruments are linked to the prices of underlying equities and bonds. On an average day in 2018, market participants traded over 1.5 million options contracts and $225 billion worth of equity futures. Hypothesis in practice Even though the historical empirical evidence suggests that the rise of indexing is unlikely to distort market prices, let’s consider the counterargument that the rise of indexing does distort markets and in turn causes prices to become less reliable. In this scenario, wouldn’t one expect stock-picking managers attempting to capture mispricing to have an increased rate of success over time? Exhibit 3 shows little evidence that this has been the case. This chart shows the percentage of active managers that survive and beat their benchmarks over rolling three-year periods. These data show that there is no strong evidence of a link between the percentage of equity mutual fund assets in index funds and the percentage of active funds outperforming benchmark indices. Exhibit 3. Active Manager Performance Has Not Improved Percentage of Non-Index Equity Funds Outperforming for Three-Year Rolling Period, 2004–2018 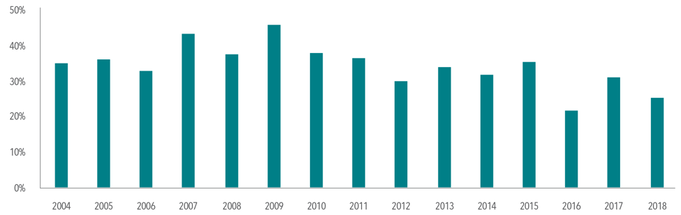 Lastly, in a world where index funds bias prices, we should expect to see evidence of such an impact across an index fund’s holdings. In other words, there should be more uniformity in the returns for securities within the same index as inflows drive prices up uniformly (and outflows drive prices down). Taking the S&P 500 Index as an example, however, we see that this has not been the case. The S&P 500 is a widely tracked index with over $9.9 trillion USD indexed or benchmarked to the index and with indexed assets comprising approximately $3.4 trillion USD of this total. Exhibit 4 shows that in 2008, a year of large net outflows and an index return of –37.0%, the constituent returns ranged from 39% to –97%. This exhibit also shows that in 2017, a year of large net inflows and a positive index return of 21.8%, the constituent returns ranged from 133.7% to –50.3%. We would also expect that constituents with similar weighting in traditional market cap-weighted indices would have similar returns. In 2017, Amazon and General Electric returned 56.0% and –42.9%, respectively, despite each accounting for approximately 1.5% of the S&P 500 Index. Exhibit 4. Range of S&P 500 Index Constituent Returns 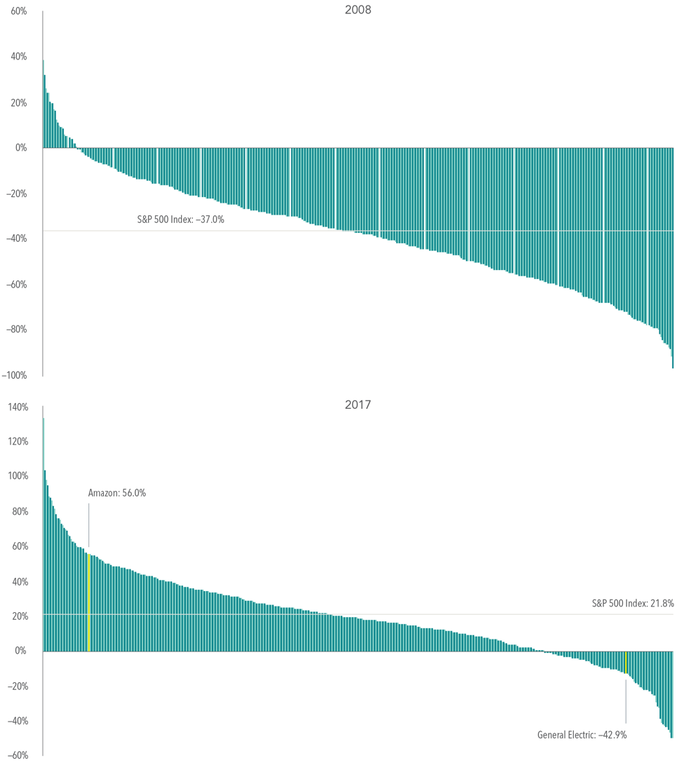 Conclusion Despite the increased popularity of index-based approaches, the data continue to support the idea that markets are working. Annual trading volume continues to be in line with prior years, indicating that market participant transactions are still driving price discovery. The majority of active mutual fund managers continue to underperform, suggesting that the rise of indexing has not made it easier to outguess market prices. Prices and returns of individual holdings within indices are not moving in lockstep with asset flows into index funds. Lastly, while naysayers will likely continue to point to indexing as a hidden danger in the market, it is important that investors keep in mind that index funds are still a small percentage of the diverse array of investor types. Investors can take comfort in knowing that markets are still functioning; willing buyers and sellers continue to meet and agree upon prices at which they desire to transact. It is also important to remember that while indexing has been a great financial innovation for many, it is only one solution in a large universe of different investment options. All data is from sources believed to be reliable but cannot be guaranteed or warranted. This information is intended for educational purposes, and it is not to be construed as an offer, solicitation, recommendation, or endorsement of any particular security, products, or services. No one should assume that any discussion or information contained in this material serves as a receipt of, or as a substitute for, personalized investment, tax or legal advice. Diversification does not eliminate the risk of market loss. Investment risks include loss of principal and fluctuating value. Past performance is not a guarantee of future results. Indices are not available for direct investment; therefore, their performance does not reflect the expenses associated with the management of an actual portfolio.
Appendix The Index Boogyman Derivative: A financial instrument whose value is based on an underlying asset or security. Options Contract: An options contract is an agreement between two parties to facilitate a potential transaction on an underlying security at a preset price. Futures: A financial contract obligating the buyer to purchase an asset or a seller to sell an asset at a predetermined future time and price. Active Manager Performance Has Not Improved: Options, futures, and corporate action data are from Bloomberg LP. Options contact volume is the sum of the 2018 daily average put and call volume of options on the S&P 500 Index, Russell 2000 Index, MSCI EAFE Index, and MSCI Emerging Markets Index. Equity futures volume is equal to total 2018 futures volume traded divided by 252, where annual volume traded is estimated as the sum of monthly volume times month-end contract value for S&P 500 Mini futures, Russell 2000 Mini futures, MSCI EAFE Mini futures, and MSCI Emerging Markets Mini futures. IPO, seasoned equity offering, and share repurchase data are based on Bloomberg corporate actions data and include countries that are eligible for Dimensional investment. Equity mutual fund outperformance percentages are shown for the three-year periods ending December 31 of each year, 2004–2018. Each sample includes equity funds available at the beginning of the three-year period. Outperformers are funds with return observations for every month of the three-year period whose cumulative net return over the period exceeded that of their respective Morningstar category index as of the start of the period. US-domiciled non-Dimensional mutual fund data is from Morningstar. Dimensional fund data provided by the fund accountant. Past performance is no guarantee of future results. For more methodology details, see the latest Mutual Fund Landscape brochure. Range of S&P 500 Index Constituent Returns: Upper chart includes 2008 total returns for constituent securities in the S&P 500 Index as of December 31, 2007. Lower chart includes 2017 total returns for constituent securities in the S&P 500 Index as of December 31, 2016. Excludes securities that delisted or were acquired during the year. Source: S&P data ©2019 S&P Dow Jones Indices LLC, a division of S&P Global. For illustrative purposes only. Indices are not available for direct investment; therefore, their performance does not reflect the expenses associated with the management of an actual portfolio. Source: Dimensional Fund Advisors LP. Past performance is no guarantee of future results. There is no guarantee an investing strategy will be successful. Investing involves risks including possible loss of principal. Diversification does not eliminate the risk of market loss. Indices are not available for direct investment. Their performance does not reflect the expenses associated with the management of an actual portfolio. All expressions of opinion are subject to change. This article is distributed for informational purposes, and it is not to be construed as an offer, solicitation, recommendation, or endorsement of any particular security, products, or services. Investors should talk to their financial advisor prior to making any investment decision. Eugene Fama and Ken French are members of the Board of Directors of the general partner of, and provide consulting services to, Dimensional Fund Advisors LP. A quick online search for “Dow rallies 500 points” yields a cascade of news stories with similar titles, as does a similar search for “Dow drops 500 points.” These types of headlines may make little sense to some investors, given that a “point” for the Dow and what it means to an individual’s portfolio may be unclear. The potential for misunderstanding also exists among even experienced market participants, given that index levels have risen over time and potential emotional anchors such as a 500-point move do not have the same impact on performance as they used to. With this in mind, we examine what a point move in the Dow means and the impact it may have on an investment portfolio. IMPACT OF INDEX CONSTRUCTION The Dow Jones Industrial Average was first calculated in 1896 and currently consists of 30 large cap US stocks. The Dow is a price-weighted index, which is different than more common market capitalization-weighted indices.1 An example may help put this difference in weighting methodology in perspective. Consider two companies that have a total market capitalization of $1,000. Company A has 1,000 shares outstanding that trade at $1 each, and Company B has 100 shares outstanding that trade at $10 each. In a market capitalization-weighted index, both companies would have the same weight since their total market caps are the same. However, in a price-weighted index, Company B would have a larger weight due to its higher stock price. This means that changes in Company B’s stock would be more impactful to a price-weighted index than they would be to a market cap-weighted index. The relative advantages and disadvantages of these methodologies are interesting topics themselves, but the main purpose of discussing the differences in this context is to point out that design choices can have an impact on index performance. Investors should be aware of this impact when comparing their own portfolios’ performance to that of an index. HEADLINES VS. REALITY Movements in the Dow are often communicated in units known as points, which signify the change in the index level. Investors should be cautious when interpreting headlines that reference point movements, as a move of, say, 500 points in either direction is less meaningful now than in the past largely because the overall index level is higher today than it was many years ago. Exhibit 1 plots what a decline of this magnitude has meant in percentage terms over time. A 500-point drop in January 1985, when the Dow was near 1,300, equated to a nearly 39% loss. A 500-point drop in December 2003, when the Dow was near 10,000, meant a much smaller 5% decline in value. And a 500-point drop in early December 2018, when the Dow hovered near 25,000, resulted in a 2% loss. 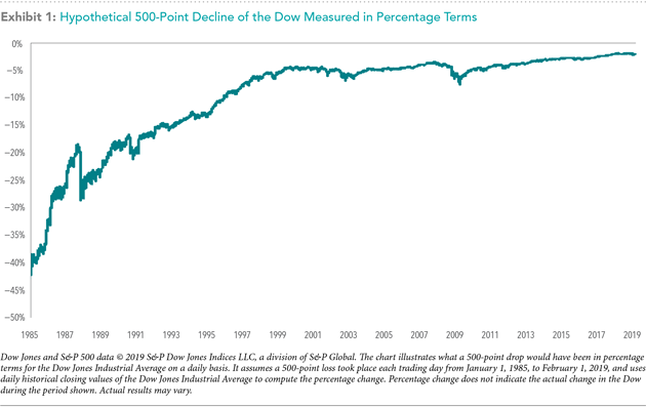 HOW DOES THE DOW RELATE TO YOUR PORTFOLIO? While the Dow and other indices are frequently interpreted as indicators of broader stock market performance, the stocks composing these indices may not be representative of an investor’s total portfolio. For context, the MSCI All Country World Investable Market Index (MSCI ACWI IMI) covers just over 8,700 large, mid, and small cap stocks in 23 developed and 24 emerging markets countries with a combined market cap of more than $50 trillion. The S&P 500 Index includes 505 large cap US stocks with approximately $23.8 trillion in combined market cap.2 The Dow is a collection of 30 large cap US stocks with a combined market cap of approximately $6.8 trillion.3 Even though the MSCI ACWI IMI, S&P 500, and Dow are all stock market indices, each one tracks different segments of the market, so their performance can differ significantly over time, as shown in Exhibit 2. Since 1995, the Dow has outperformed the S&P 500 and MSCI ACWI IMI by an average of 0.5% and 3.3%, respectively (based on calendar year returns). However, relative performance in individual years can be much different. For example, in 1997, the Dow underperformed the S&P 500 by 8.4% but outperformed the MSCI ACWI IMI by 13.9%. It is also important to note that some investors may be concerned about other asset classes besides stocks. Depending on investor needs, a diversified portfolio may include a mix of global stocks, bonds, commodities, and any number of other assets not represented in a stock index. A portfolio’s performance should always be evaluated within the context of an investor’s specific goals. Understanding how a personal portfolio compares to broadly published indices like the Dow can give investors context about how headlines apply to their own situation. 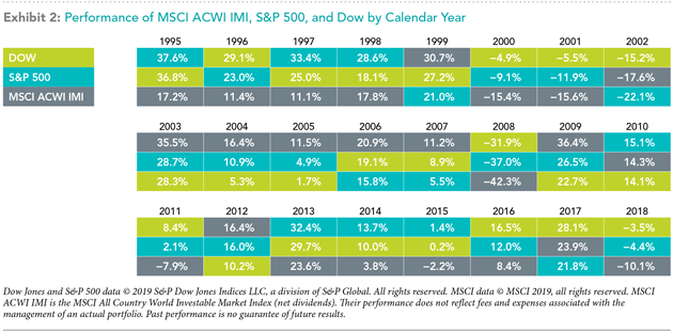 CONCLUSION News headlines are often written to grab attention. A headline publicizing a 500-point move in the Dow may trigger an emotional response and, depending on the direction, sound either exciting or ominous enough to warrant reading the article. However, after digging further, we can see that the insights such headlines offer may be limited, especially if investors hold portfolios designed and managed daily to meet their individual goals, needs, and preferences in a broadly diversified and cost-effective manner. Appendix
1. Market capitalization is the product of price and shares outstanding. 2. 500 companies are included in the S&P 500 Index. However, because some of these companies have multiple classes of stock that meet the requirements for inclusion, the total number of stocks tracked by the index is 505. 3. Market cap data as of January 31, 2019. Past performance is no guarantee of future results. This information is provided for educational purposes only and should not be considered. investment advice or a solicitation to buy or sell securities. There is no guarantee an investing strategy will be successful. Investing involves risks including possible loss of principal. Diversification does not eliminate the risk of market loss. Dimensional Fund Advisors LP is an investment advisor registered with the Securities and Exchange Commission. When selecting strategies for their portfolios, investors are often tempted to seek out the latest and greatest investment opportunities. Over the years, these approaches have sought to capitalize on developments such as the perceived relative strength of particular geographic regions, technological changes in the economy, or the popularity of different natural resources. But long-term investors should be aware that letting short-term trends influence their investment approach may be counterproductive. As Nobel laureate Eugene Fama said, “There’s one robust new idea in finance that has investment implications maybe every 10 or 15 years, but there’s a marketing idea every week.” WHAT’S HOT BECOMES WHAT’S NOT Looking back at some investment fads over recent decades can illustrate how often trendy investment themes come and go. In the early 1990s, attention turned to the rising “Asian Tigers” of Hong Kong, Singapore, South Korea, and Taiwan. A decade later, much was written about the emergence of the “BRIC” countries of Brazil, Russia, India, and China and their new place in global markets. Similarly, funds targeting hot industries or trends have come into and fallen out of vogue. In the 1950s, the “Nifty Fifty” were all the rage. In the 1960s, “go‑go” stocks and funds piqued investor interest. Later in the 20th century, growing belief in the emergence of a “new economy” led to the creation of funds poised to make the most of the rising importance of information technology and telecommunication services. During the 2000s, 130/30 funds, which used leverage to sell short certain stocks while going long others, became increasingly popular. In the wake of the 2008 financial crisis, “Black Swan” funds, “tail-risk-hedging” strategies, and “liquid alternatives” abounded. As investors reached for yield in a low interest rate environment in the following years, other funds sprang up that claimed to offer increased income generation, and new strategies like unconstrained bond funds proliferated. More recently, strategies focused on peer-to-peer lending, cryptocurrencies, and even cannabis cultivation and private space exploration have become more fashionable. In this environment, so-called “FAANG” stocks and concentrated exchange-traded funds with catchy ticker symbols have also garnered attention among investors. THE FUND GRAVEYARD Unsurprisingly, however, numerous funds across the investment landscape were launched over the years only to subsequently close and fade from investor memory. While economic, demographic, technological, and environmental trends shape the world we live in, public markets aggregate a vast amount of dispersed information and drive it into security prices. Any individual trying to outguess the market by constantly trading in and out of what’s hot is competing against the extraordinary collective wisdom of millions of buyers and sellers around the world. With the benefit of hindsight, it is easy to point out the fortune one could have amassed by making the right call on a specific industry, region, or individual security over a specific period. While these anecdotes can be entertaining, there is a wealth of compelling evidence that highlights the futility of attempting to identify mispricing in advance and profit from it. It is important to remember that many investing fads, and indeed, most mutual funds, do not stand the test of time. A large proportion of funds fail to survive over the longer term. Of the 1,622 fixed income mutual funds in existence at the beginning of 2004, only 55% still existed at the end of 2018. Similarly, among equity mutual funds, only 51% of the 2,786 funds available to US-based investors at the beginning of 2004 endured. WHAT AM I REALLY GETTING? When confronted with choices about whether to add additional types of assets or strategies to a portfolio, it may be helpful to ask the following questions: 1. What is this strategy claiming to provide that is not already in my portfolio? 2. If it is not in my portfolio, can I reasonably expect that including it or focusing on it will increase expected returns, reduce expected volatility, or help me achieve my investment goal? 3. Am I comfortable with the range of potential outcomes? If investors are left with doubts after asking any of these questions, it may be wise to use caution before proceeding. Within equities, for example, a market portfolio offers the benefit of exposure to thousands of companies doing business around the world and broad diversification across industries, sectors, and countries. While there can be good reasons to deviate from a market portfolio, investors should understand the potential benefits and risks of doing so. In addition, there is no shortage of things investors can do to help contribute to a better investment experience. Working closely with a financial advisor can help individual investors create a plan that fits their needs and risk tolerance. Pursuing a globally diversified approach; managing expenses, turnover, and taxes; and staying disciplined through market volatility can help improve investors’ chances of achieving their long-term financial goals. CONCLUSION Fashionable investment approaches will come and go, but investors should remember that a long-term, disciplined investment approach based on robust research and implementation may be the most reliable path to success in the global capital markets. Appendix
Past performance is no guarantee of future results. This information is provided for educational purposes only and should not be considered investment advice or a solicitation to buy or sell securities. There is no guarantee an investing strategy will be successful. Diversification does not eliminate the risk of market loss. Eugene Fama is a member of the Board of Directors of the general partner of, and provides consulting services to, Dimensional Fund Advisors LP. Dimensional Fund Advisors LP is an investment advisor registered with the Securities and Exchange Commission. As much as I value the unfettered access to information the internet provides, I recognize the potential harm that too much information can cause. Take, for example, a friend of mine, who was experiencing some troubling medical symptoms. Typing her symptoms into a search engine led to an evening of research and mounting consternation. By the end of the night, the vast quantity of unfiltered information led her to conclude that something was seriously wrong. One of the key characteristics that distinguishes an expert is their ability to filter information and make increasingly refined distinctions about the situation at hand. For example, you might describe your troubling symptoms to a doctor simply as a pain in the chest, but a trained physician will be able to ask questions and test several hypotheses before reaching the conclusion that rather than having the cardiac arrest you suspected, you have something completely different. While many of us may have the capacity to elevate our understanding to a high level within a chosen field, reaching this point takes time, dedication, and experience. My friend, having convinced herself that something was seriously wrong, booked an appointment with a physician. The doctor asked several pertinent questions, performed some straightforward tests, and recommended the following treatment plan: reassurance and education. Not surgery. Not drugs. But an understanding of why and how she had experienced her condition. The consultative nature of a relationship with a trusted professional—both when a situation arises and as we progress through life—is one of the key benefits that an expert can provide. There are striking parallels with the work of a professional financial advisor. The first responsibility of the doctor or advisor is to understand the person they’re serving so that they can fully assess their situation. Once the plan is underway, the role of the professional is to monitor the person’s situation, evaluate if the course of action remains appropriate, and help to maintain the discipline required for the plan to work as intended. Like my friend’s doctor, advisors may have experienced conversations with clients that are triggered by news reports or informed by unqualified sources. In some cases, all that is required to help put the client’s mind at ease is a reminder to focus on what is in their control as well as providing reassurance and (re)education that they have a financial plan in place that is helping them move toward their objectives. The benefits of working with the right advisor are demonstrated through the ability to both help clients pursue their financial goals and to help them have a positive experience along the way. Trouble might arise when we confuse simple and complex conditions. Probably no harm is done when a person, recognizing the onset of a common cold, takes cold medicine, drinks plenty of fluids, and rests. But had my self-diagnosing friend not made an appointment with a specialist, and instead moved from self-diagnosis to self-medication, she may have caused herself real harm. Similarly, thinking that all aspects of your own financial situation can be handled through a basic internet search or casual conversation with a friend might result in a less than optimal financial outcome. Without the guidance of an advisor, the self-medicating investor might overreact to short-term market volatility by selling some of their investments. In doing so, they risk missing out on some of the best days since there is no reliable way to predict when positive returns in equity markets will occur.1 One might think that missing a few days of strong returns would not make much difference over the long term. But, as illustrated in Exhibit 1, had an investor missed the 25 single best days in the world’s biggest equity market, the US, between 1990 and the end of 2017, their annualized return would have dropped from 9.81% to 4.53%. Such an outcome can have a major impact on an investor’s financial “treatment” plan. 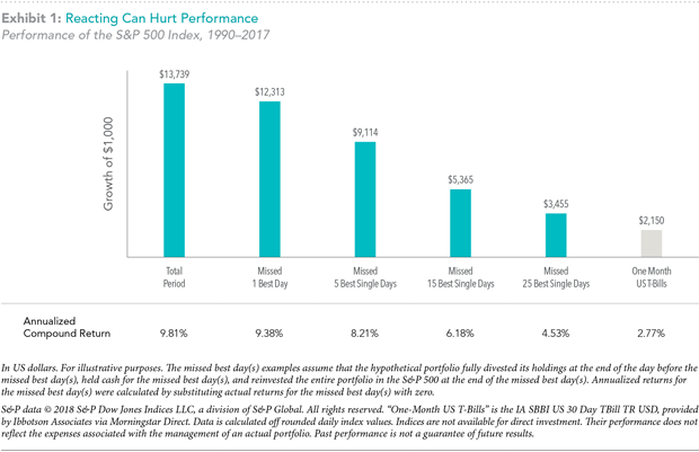 Improving someone’s financial health is a lot like improving their physical health. The challenges associated with pursuing a better financial outcome include diagnosis of the current situation, development of the appropriate course of action, and sticking with the treatment plan. Many advisors are trained on the intricacies of complex financial situations and work to understand how their clients feel about money and how their clients might react to future events. By providing the prescription of reassurance and education over time, we believe the right advisor can play a vital and irreplaceable role in investors’ lives. Article by David R. Jones EMEA and Vice President, Dimensional Fund Advisors
1. The 2018 Mutual Fund Landscape report compiled by Dimensional showed that for the 15-year period through 2017, only 14% of US equity mutual funds and 13% of US fixed income mutual funds survived and outperformed their benchmark after costs. Refer to us.dimensional.com/perspectives/mutual-fund-landscape-2018 for more information. Dimensional makes no representation as to the suitability of any advisor, and we do not endorse, recommend, or guarantee the services of any advisor, including those in the Find an Advisor portion of our website. Investors should carefully and thoroughly evaluate any advisor whom they consider hiring or working with. There is no guarantee investment strategies will be successful. Investing involves risks, including possible loss of principal. There is always the risk that an investor may lose money. A long-term investment approach cannot guarantee a profit. Results for other time periods, including shorter time periods, may include losses. As 2019 approaches, and with US stocks outperforming non-US stocks in recent years, some investors have again turned their attention towards the role that global diversification plays in their portfolios. For the five-year period ending October 31, 2018, the S&P 500 Index had an annualized return of 11.34% while the MSCI World ex USA Index returned 1.86%, and the MSCI Emerging Markets Index returned 0.78%. As US stocks have outperformed international and emerging markets stocks over the last several years, some investors might be reconsidering the benefits of investing outside the US. While there are many reasons why a US-based investor may prefer a degree of home bias in their equity allocation, using return differences over a relatively short period as the sole input into this decision may result in missing opportunities that the global markets offer. While international and emerging markets stocks have delivered disappointing returns relative to the US over the last few years, it is important to remember that: 1. Non-US stocks help provide valuable diversification benefits. 2. Recent performance is not a reliable indicator of future returns. 2. Recent performance is not a reliable indicator of future returns. There’s a World of Opportunity in Equities The global equity market is large and represents a world of investment opportunities. As shown in Exhibit 1, nearly half of the investment opportunities in global equity markets lie outside the US. Non-US stocks, including developed and emerging markets, account for 48% of world market capitalization and represent thousands of companies in countries all over the world. A portfolio investing solely within the US would not be exposed to the performance of those markets. Exhibit 1. World Equity Market Capitalization 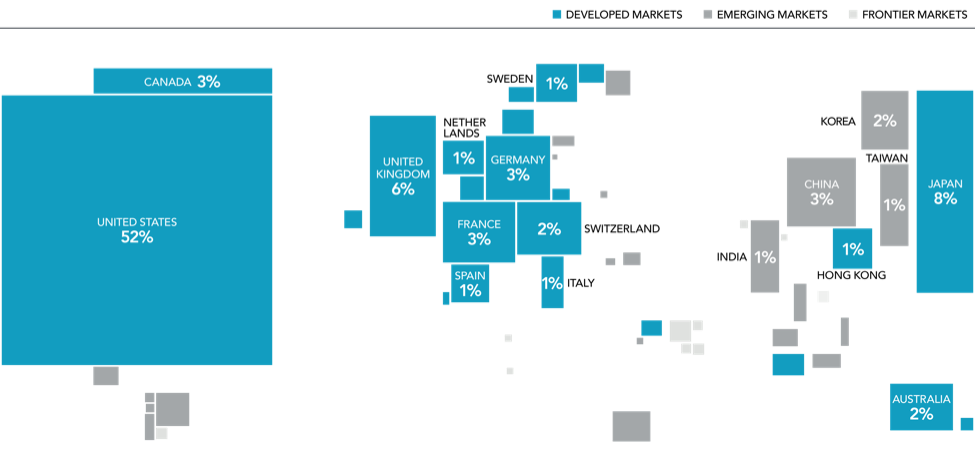 The Lost Decade We can examine the potential opportunity cost associated with failing to diversify globally by reflecting on the period in global markets from 2000–2009. During this period, often called the “lost decade” by US investors, the S&P 500 Index recorded its worst ever 10year performance with a total cumulative return of –9.1%. However, looking beyond US large cap equities, conditions were more favorable for global equity investors as most equity asset classes outside the US generated positive returns over the course of the decade. (See Exhibit 2.) Expanding beyond this period and looking at performance for each of the 11 decades starting in 1900 and ending in 2010, the US market outperformed the world market in five decades and underperformed in the other six. This further reinforces why an investor pursuing the equity premium should consider a global allocation. By holding a globally diversified portfolio, investors are positioned to capture returns wherever they occur. Exhibit 2. Global Index Returns, January 2000–December 2009 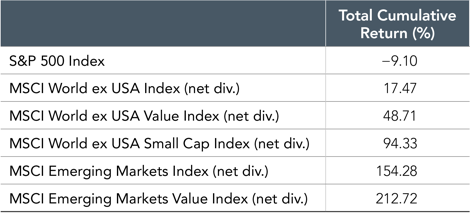 Pick a Country? Are there systematic ways to identify which countries will outperform others in advance? Exhibit 3 illustrates the randomness in country equity market rankings (from highest to lowest) for 22 different developed market countries over the past 20 years. This graphic conveys how difficult it would be to execute a strategy that relies on picking the best country and the resulting importance of diversification. Exhibit 3. Equity Returns of Developed Markets  In addition, concentrating a portfolio in any one country can expose investors to large variations in returns. The difference between the best and worst‐performing countries can be significant. For example, since 1998, the average return of the best‐performing developed market country was approximately 44%, while the average return of the worst performing country was approximately –16%. Diversification means an investor’s portfolio is unlikely to be the best or worst performing relative to any individual country, but diversification also provides a means to achieve a more consistent outcome and more importantly helps reduce and manage catastrophic losses that can be associated with investing in just a small number of stocks or a single country. A Diversified Approach Over long periods of time, investors may benefit from consistent exposure in their portfolios to both US and non‐US equities. While both asset classes offer the potential to earn positive expected returns in the long run, they may perform quite differently over short periods. While the performance of different countries and asset classes will vary over time, there is no reliable evidence that this performance can be predicted in advance. An approach to equity investing that uses the global opportunity set available to investors can provide diversification benefits as well as potentially higher expected returns. Appendix
[1]. The total market value of a company’s outstanding shares computed as price times shares outstanding. [2]. Source: Annual country index return data from the Dimson-Marsh-Staunton (DMS) Global Returns Data, provided by Morningstar, Inc. World Equity Market Capitalization: As of December 31, 2017. Data provided by Bloomberg. Market cap data is free-float adjusted and meets minimum liquidity and listing requirements. China market capitalization excludes A-shares, which are generally only available to mainland China investors. For educational purposes; should not be used as investment advice. Global Index Returns: S&P data © 2018 S&P Dow Jones Indices LLC, a division of S&P Global. All rights reserved. MSCI data © MSCI 2018, all rights reserved. Indices are not available for direct investment. Index performance does not reflect expenses associated with the management of an actual portfolio. Past performance is not a guarantee of future results. Equity Returns of Global Markets: Source: MSCI country indices (net dividends) for each country listed. Does not include Israel, which MSCI classified as an emerging market prior to May 2010. MSCI data © MSCI 2018, all rights reserved. Past performance is no guarantee of future results. Indices are not available for direct investment; therefore, their performance does not reflect the expenses associated with the management of an actual portfolio. Source: Dimensional Fund Advisors LP. Indices are not available for direct investment. Their performance does not reflect the expenses associated with the management of an actual portfolio. Past performance is not a guarantee of future results. Diversification does not eliminate the risk of market loss.There is no guarantee investment strategies will be successful. Investing involves risks, including possible loss of principal. Investors should talk to their financial advisor prior to making any investment decision. All expressions of opinion are subject to change. This article is distributed for informational purposes, and it is not to be construed as an offer, solicitation, recommendation, or endorsement of any particular security, products, or services. Investors should talk to their financial advisor prior to making any investment decision It’s almost Election Day in the US once again. For those who need a brief civics refresher, every two years the full US House of Representatives and one-third of the Senate are up for reelection. While the outcomes of the elections are uncertain, one thing we can count on is that plenty of opinions and prognostications will be floated in the days to come. In financial circles, this will almost assuredly include any potential for perceived impact on markets. But should long-term investors focus on midterm elections? MARKETS WORK We would caution investors against making short-term changes to a long-term plan to try to profit or avoid losses from changes in the political winds. For context, it is helpful to think of markets as a powerful information-processing machine. The combined impact of millions of investors placing billions of dollars’ worth of trades each day results in market prices that incorporate the aggregate expectations of those investors. This makes outguessing market prices consistently very difficult.[1] While surprises can and do happen in elections, the surprises don’t always lead to clear-cut outcomes for investors. The 2016 presidential election serves as a recent example of this. There were a variety of opinions about how the election would impact markets, but many articles at the time posited that stocks would fall if Trump were elected.[1] The day following President Trump’s win, however, the S&P 500 Index closed 1.1% higher. So even if an investor would have correctly predicted the election outcome (which was not apparent in pre-election polling), there is no guarantee that they would have predicted the correct directional move, especially given the narrative at the time. But what about congressional elections? For the upcoming midterms, market strategists and news outlets are still likely to offer opinions on who will win and what impact it will have on markets. However, data for the stock market going back to 1926 shows that returns in months when midterm elections took place did not tend to be that different from returns in any other month. Exhibit 1 shows the frequency of monthly returns (expressed in 1% increments) for the S&P 500 Index from January 1926–August 2018. Each horizontal dash represents one month, and each vertical bar shows the cumulative number of months for which returns were within a given 1% range (e.g., the tallest bar shows all months where returns were between 1% and 2%). The blue and red horizontal lines represent months during which a midterm election was held, with red meaning Republicans won or maintained majorities in both chambers of Congress, and blue representing the same for Democrats. Striped boxes indicate mixed control, where one party controls the House of Representatives, and the other controls the Senate, while gray boxes represent non-election months. This graphic illustrates that election month returns were well within the typical range of returns, regardless of which party won the election. Results similarly appeared random when looking at all Congressional elections (midterm and presidential) and for annual returns (both the year of the election and the year after). Exhibit 1. Midterm Elections and S&P 500 Index Returns, Histogram of Monthly Returns January 1926–August 2018 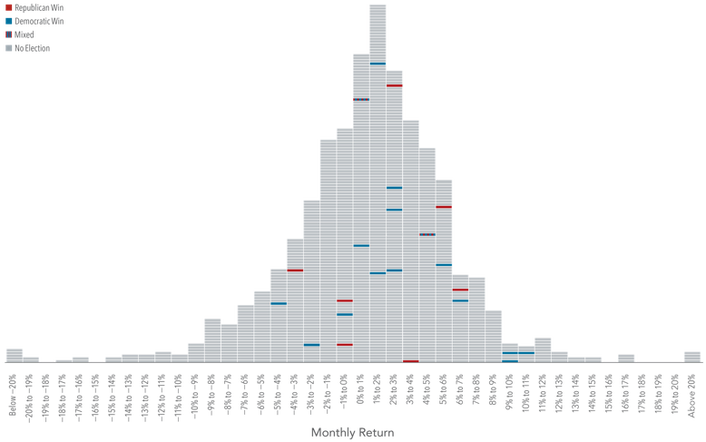 Past performance is not a guarantee of future results. Indices are not available for direct investment; therefore, their performance does not reflect the expenses associated with the management of an actual portfolio. S&P data © 2018 S&P Dow Jones Indices LLC, a division of S&P Global. All rights reserved. IN IT FOR THE LONG HAUL While it can be easy to get distracted by month-to-month or even one-year returns, what really matters for long-term investors is how their wealth grows over longer periods of time. Exhibit 2 shows the hypothetical growth of wealth for an investor who put $1 in the S&P 500 Index in January 1926. Again, the chart lays out party control of Congress over time. And again, both parties have periods of significant growth and significant declines during their time of majority rule. However, there does not appear to be a pattern of stronger returns when any specific party is in control of Congress, or when there is mixed control for that matter. Markets have historically continued to provide returns over the long run irrespective of (and perhaps for those who are tired of hearing political ads, even in spite of) which party is in power at any given time. Exhibit 2. Hypothetical Growth of $1 Invested in the S&P 500 Index and Party Control of Congress January 1926–August 2018 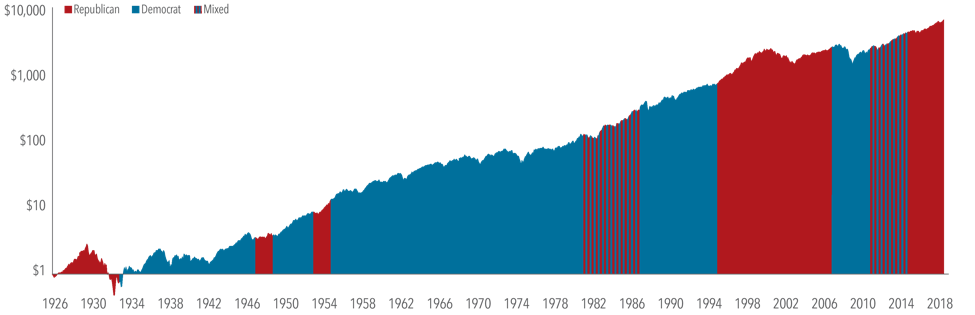 Past performance is not a guarantee of future results. Indices are not available for direct investment; therefore, their performance does not reflect the expenses associated with the management of an actual portfolio. S&P data © 2018 S&P Dow Jones Indices LLC, a division of S&P Global. All rights reserved. Equity markets can help investors grow their assets, and we believe investing is a long-term endeavor. Trying to make investment decisions based on the outcome of elections is unlikely to result in reliable excess returns for investors. At best, any positive outcome based on such a strategy will likely be the result of random luck. At worst, it can lead to costly mistakes. Accordingly, there is a strong case for investors to rely on patience and portfolio structure, rather than trying to outguess the market, to pursue investment returns. Source: Dimensional Fund Advisors LP.
Indices are not available for direct investment. Their performance does not reflect the expenses associated with the management of an actual portfolio. Past performance is not a guarantee of future results. Diversification does not eliminate the risk of market loss. There is no guarantee investment strategies will be successful. Investing involves risks, including possible loss of principal. Investors should talk to their financial advisor prior to making any investment decision. There is always the risk that an investor may lose money. A long-term investment approach cannot guarantee a profit. All expressions of opinion are subject to change. This article is distributed for informational purposes, and it is not to be construed as an offer, solicitation, recommendation, or endorsement of any particular security, products, or services. Investors should talk to their financial advisor prior to making any investment decision. [1]. This is known as the efficient market theory, which postulates that market prices reflect the knowledge and expectations of all investors and that any new development is instantaneously priced into a security. [2]. Examples include: “A Trump win would sink stocks. What about Clinton?” CNN Money, 10/4/16, “What do financial markets think of the 2016 election?” Brookings Institution, 10/21/16, “What Happens to the Markets if Donald Trump Wins?” New York Times, 10/31/16. What do attorneys, psychiatrists, tax & financial professionals all have in common? While it may feel like a punchline is coming, what I’m referring to is what they offer. Their primary product is intellectual capital, something intangible that we can’t necessarily feel or touch. Patients/clients are tasked with quantifying the value of it. The question is: How? I could argue the following insight is applicable to lots of professions, but coming from a guy who runs a wealth management firm, I’ll keep this commentary on the financial side of the spectrum. Numerous studies have been conducted in an attempt to broadly measure the monetary benefits of working with an advisor. Here, I’ll walk through a simple critical thinking exercise, purely designed to help investors make informed decisions. First, it’s important to point out the human element. Based on our experiences, we all have biases when it comes to interpreting value. Most of us possess situational skepticism’s thanks in part to a daily dosage of fly-by-night quick fixes, aimed at lightening our pockets. If you believe that all physiatrists are quacks, all lawyers are ambulance chasers, or all financial services professionals are salespeople, you probably have a preconception which will inevitably factor into how you value their advice. Personal Due Diligence: A Litmus Test for Seeking Financial Advice
Let’s break those down a bit further. Experience: The question really isn’t whether or not you can do it yourself. The question that’s more applicable is can you do it “well”? The biggest challenge I commonly see with do-it-yourself investors stems from understanding how and why financial planning and investment management are related. After analyzing thousands of portfolios through the years, here are some of the most common deficiencies in no particular order.
Time: Markets and investment vehicles are constantly evolving. Therefore, investment portfolios should evolve as well. We’re always learning more about expected return and where it comes from. As we do, investment providers are quick to adapt, offering solutions with incremental improvements. The problem is, there’s lots of them. At last check, there were around 7,000 mutual funds and over 2,000 ETF’s (Exchange Traded Funds) in existence. This underscores the importance of recognizing that financial planning isn’t a one-time thing but an ongoing event that requires adjustment with life events. Investments, taxation, insurance and estate planning all need to be working in concert. Collectively, this amounts to a lot more time than many realize, which often leads to a lack of attention. Desire: Does the on-going, in-depth examination of your financial situation interest you or not? If you don’t enjoy working on cars, you’re probably not keen on repairing your own transmission. The concept of hiring professionals in different capacities effectively allows us to spend time doing what we enjoy, or what we do best. Discipline: This goes way beyond the idea of having someone there to hold your hand. Yes, psychology plays a role. However, discipline runs deeper than simply resisting reactions to every market movement. We know it applies to investing, but it must also apply to financial planning. Purchasing a home, having a child, changing jobs, marriage, college, retirement etc. are life events that require sound financial adjustments. When it comes to managing your portfolio, the behavioral impact on investing is well documented. It’s easy enough to say, “disciplined investors have historically been rewarded for maintaining that discipline.” However, doing so requires not only a steady hand but also a dedicated understanding of capital markets and how a host of different scenarios affect your unique situation. We've been through around half a dozen bull and bear markets over the last 30 years. Needless to say, long-term investors are likely to experience a bunch of them over a lifetime. Net New Cash Flow to Equity Mutual Funds Typically Is Related to World Equity Returns Monthly, 2002-2017 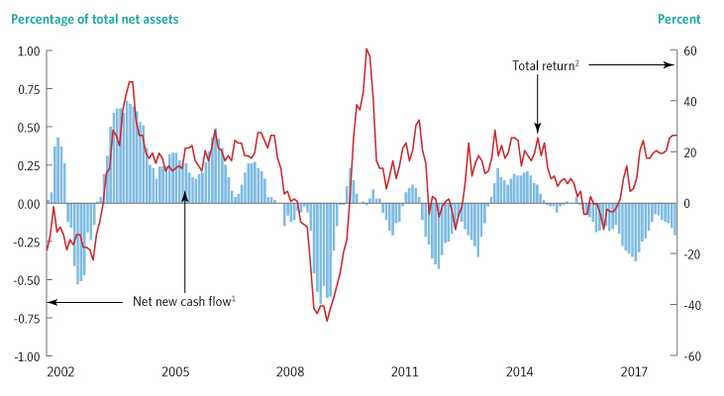 Net new cash flow is the percentage of previous month-end equity mutual fund total net assets, plotted as a six-month moving average. The total return on equities is measured as the year-over-year percent change in the MSCI All Country World Daily Gross Total Return Index. Sources: Investment Company Institute, MSCl, and Bloomberg The history of mutual fund cash flows through the years paints a difficult picture for investor behavior. In 2008, we saw large outflows in equity mutual funds right around the bottom of the market. Subsequently, we saw positive cash flows in the ladder part of 2009 and into 2010 long after markets went into recovery mode. Remember the age old adage about being a successful investor “Buy Low, Sell High”? Well, the opposite often happens and emotional discipline is frequently the culprit. Contingency: Confidence in all of the above isn’t enough to ensure a favorable outcome. Many overlook the capacity of their heirs to make sound decisions in the event that they no longer can. Death, disability or incapacity impacts everyone. Prudence dictates an analysis of capable contingencies. Professional Due Diligence: Aptitude, Delivery, Services, Comparatives When weighing the value of financial advice, it’s critical to understand the substantial differences between types of financial advisors. Many lack the credentials or even legal authority qualify what they offer as advice in the first place. Brokers are not advisors and Fee-Based is not the same as Fee-Only. Here, I’ll focus on Fee-Only fiduciary advice, the industry standard for placing the clients’ interests first 100% of the time. Aptitude: This encompasses the combination of experience, education, and reputation. Experience: In finance, there’s little substitute for the seasoned experience an advisor receives through a variety of different market cycles and with a variety of different types of clients. Education: Undergraduate business degree’s and MBA’s demonstrate a commitment to education. Industry designations such as CFP® (Certified Financial Planner) or CFA (Chartered Financial Analyst) further indicate levels of expertise. Reputation: Any due diligence should begin with a baseline evaluation of regulatory history (run a background check). Also, look for specific examples of expertise. Many advisors are active contributors to media outlets. Read columns or interviews to get insight into their investment philosophy or planning approach. Tip: Start with the firm’s website. Services: Carefully understanding what’s included and what isn’t is essential because service offerings are all over the map. Does the advisor provide one-time financial planning services, ongoing investment management services, the combination of both? How much access do you have to professionals? What types of reports and online access do you receive? Delivery: How do you want to interact with an advisor? There’s a cost to doing business. Face to face interaction is costlier than email, phone or video. Therefore, it’s reasonable to expect a premium on face to face interaction. Comparatives: After determining what’s included and what isn’t you can then analyze the market rate for these services. Recent study  Conclusion A comprehensive approach to quantifying value helps to diligently explore elements that often get overlooked. Investors should strive to understand themselves, their strengths and limitations before jumping straight into the evaluation of an advisory firm. Starting off with a basic Litmus test helps to solidify the rationale for seeking or not seeking advice. It’s about placing a timeline of personal due diligence in front of professional due diligence with the goal of making informed decisions. Our daily lives are crammed with punchlines and parables. Investing has a language of sayings and catchphrases of its own. Some encourage action, others espouse knowledge. This column highlights some of the more well known. Good, bad or indifferent.
The Hazardous We begin with what Sir John Templeton called “The four most dangerous words in investing: 'this time it's different.’” There are different interpretations of the quote but most regularly it applies to ignoring history at your own peril. When in reference to the stock market, there’s always going to be unforeseen ups and downs but overtime more ups than downs. Long term disciplined investors have historically been rewarded for maintaining that discipline despite the opinions of pundits and prognosticators. Buy low, sell high. It’s probably the most simplistic expression, yet the most difficult in practical application. Namely, buying when things appear bleakest and selling when things look great isn’t exactly a natural human inclination. In fact, looking at equity mutual fund cash flows through the years, exactly the opposite is the tendency. The last market downturn saw massive outflows in 2008, reversing course in the ladder part of 2009 well after markets went into recovery mode. I got in early. Usually, you see this in reference to a perceived new investment idea. The issue is, it’s almost impossible to quantify the statement thanks to the speed at which information travels and is incorporated into prices. Simply put, an investor really has no way of knowing if they got in early and should most often work under the assumption that prices reflect all available information. Similarly, “Buy the rumor, sell the news” speaks to speculation on what could happen, while failing to comprehend how much of the “rumor” has already been factored into current prices. “I’m waiting for the pullback” suggests that prices in some way are inaccurate and an investor has the foresight to time the market perfectly in order to take advantage of a subsequent uptick. The perils of attempting to time the market are well documented. The problem is making a single accurate decision isn’t nearly good enough. To be a successful an investor would have to decide when to get in and when to get out multiple times over an investment lifetime. The trend is your friend. That is of course until it’s not, meaning- keep buying when it appears to be going up and start selling when it goes down. One of the biggest mistakes investors make is failing to recognize that markets operate on “news” which by definition is unpredictable or else it wouldn’t be news. Essentially, there’s no way of knowing what is a trend and what isn’t. It’s a market of stocks, not a stock market. This classic day trader proverb implies that you can always make money providing you pick the right stocks. The issue with stock speculation is the evidence of long term success isn’t remotely on the side of active traders. Bulls make money, bears make money, pigs get slaughtered. This demonstrates an active trader’s mentality that superior skill can make money in any market, but only within the confines of their own greed. Again, we see speculation on when to get in and when to get out, a short term mentality that requires the daunting task of accurately identifying when a stock is over or underpriced. On the flip side: Here’s some of the wisest I’d compare stock pickers to astrologers but I don’t want to bad mouth astrologers. Rarely at a loss for words, the father of modern finance and Nobel Prize winner Eugene Fama speaks to the difficulties in identifying stock miss pricings. Based on decades of data, studies have shown that the average actively managed dollar is far more likely to underperform the average passively managed dollar. Warren Buffet is probably the most quoted investor of our time with gems like “When the tide goes out, you see who’s swimming naked” in reference to having a lack of diversification in your portfolio when markets pull back. In these instances, concentrated exposures in any one specific investment can spell disaster for a portfolio. Other Buffet favorites include: “The most important quality for an investor is temperament, not intellect” and “Be fearful when others are greedy. Be greedy when others are fearful" both speaking to the well-known emotional tendencies of investors. Above all, patience and levelheadedness are two attributes that investors should hold in the highest regard. John Maynard Keynes’s famous line “Markets can stay irrational longer than you can stay solvent” has been used to describe a variety of scenarios not limited to the disposition of investors and the unpredictable nature of markets. We’ve been through five different bull and bear markets over the last 27 years, each with significant variations in how long they lasted. Author of “The Intelligent Investor,” value investing pioneer Benjamin Graham spoke to "The investor's chief problem, even his worst enemy, is likely to be himself." Most investors have emotional attachments to hard earned money, which can lead to decisions that are detrimental to long term success. He also thought that “To be an investor you must be a believer in a better tomorrow.” It’s a basic prerequisite to believe that advancements in technology, standards of living, and ultimately profits will rise over time. Without this ideology, there would simply be no reason to invest. Index Investing pioneer and Vanguard founder John Bogle provided some simplistic advice in reference to having all your exposure to stocks "If you have trouble imagining a 20% loss in the stock market, you shouldn't be in stocks". It’s critical to thoroughly understand your risk tolerance for market fluctuation. As your exposure to stocks increases, generally speaking, so does the level of risk in your portfolio. An investor should never take more risk than they can sleep with at night. Nobel laureate Paul Samuelson felt "Investing should be more like watching paint dry or watching grass grow. If you want excitement, take $800 and go to Las Vegas." There’s a difference between investing and speculating. The whole idea of being an investor is to grow assets over the long term. Aligning long term investment growth with short term entertainment isn’t a heck of a lot different than gambling. Finally, a few warnings about the wisdom of Wall Street and giving too much credence to media pundits. “There seems to be an unwritten rule on Wall Street: If you don’t understand it, then put your life savings into it.” - Peter Lynch Many of the financial products coming out of Wall Street over the years are bought and sold on the premise of being the next hot thing. As rule of thumb, you should always know how your money is invested, complete with a thorough understanding of the potential risk, fee’s and liquidity associated with any investment vehicle. And Ex-Daily show host John Stewart on the 2008 market downturn: “If I’d only followed CNBC’s advice, I’d have a million dollars today. Provided I’d started with a hundred million dollars.” Don’t’ put too much stock in the daily commentary from talking heads whose job is to keep you reading, listening or watching. Instead, focus on your unique situation and look for help from qualified professionals who have your best interest in mind. It’s certainly not a comprehensive list but I hope you enjoyed it. The next time you hear one of these phrases remember to keep it in the proper context. When the prices of goods and services increase over time, consumers can buy fewer of them with every dollar they have saved. This erosion of the real purchasing power of wealth is called inflation. Inflation is an important element of investing. In many cases, the reason for saving today is to support future spending. Therefore, keeping pace with inflation is a crucial goal for many investors. To help understand inflation’s impact on purchasing power, consider the following illustration of the effects of inflation over time. In 1916, nine cents would buy a quart of milk. Fifty years later, nine cents would only buy a small glass of milk. And more than 100 years later, nine cents would only buy about seven tablespoons of milk. How can investors potentially prevent this loss of purchasing power from inflation over time? Exhibit 1. Your Money Today Will Likely Buy Less Tomorrow 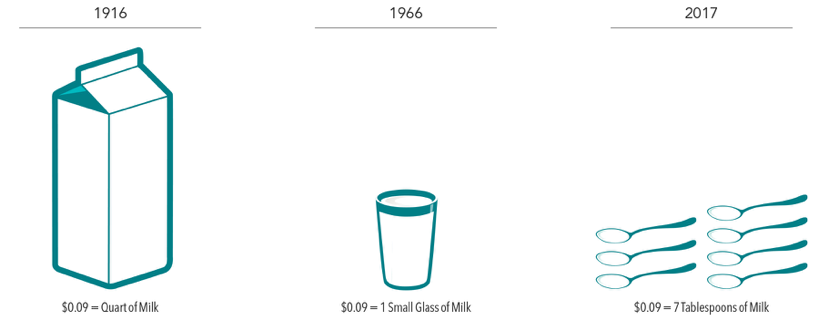 In US dollars. Source for 1916 and 1966: Historical Statistics of the United States, Colonial Times to 1970/US Department of Commerce. Source for 2017: US Department of Labor, Bureau of Labor Statistics, Economic Statistics, Consumer Price Index—US City Average Price Data. Investing for the long term and other “tips” As the value of a dollar declines over time, investing can help grow wealth and preserve purchasing power. Investors should know that over the long haul stocks have historically outpaced inflation, but there have also been short-term stretches where this has not been the case. For example, during the 17-year period from 1966–1982, the return of the S&P 500 Index was 6.8% before inflation, but after adjusting for inflation it was 0%. Additionally, if we look at the period from 2000–2009, the so-called “lost decade,” the return of the S&P 500 Index dropped from –0.9% before inflation to –3.4% after inflation. Despite some periods where stocks have failed to outpace inflation, one dollar invested in the S&P 500 Index in 1926, after accounting for inflation, would have grown to more than $500 of purchasing power at the end of 2017 and would have significantly outpaced inflation over the long run. The story for US Treasury bills (T-bills), however, is quite different. In many periods, T-bills were unable to keep pace with inflation, and an investor would have experienced an erosion of purchasing power. After adjusting for inflation, one dollar invested in T-bills in 1926 would have grown to only $1.51 at the end of 2017. Exhibit 2. Growth of $1, 1926–2017 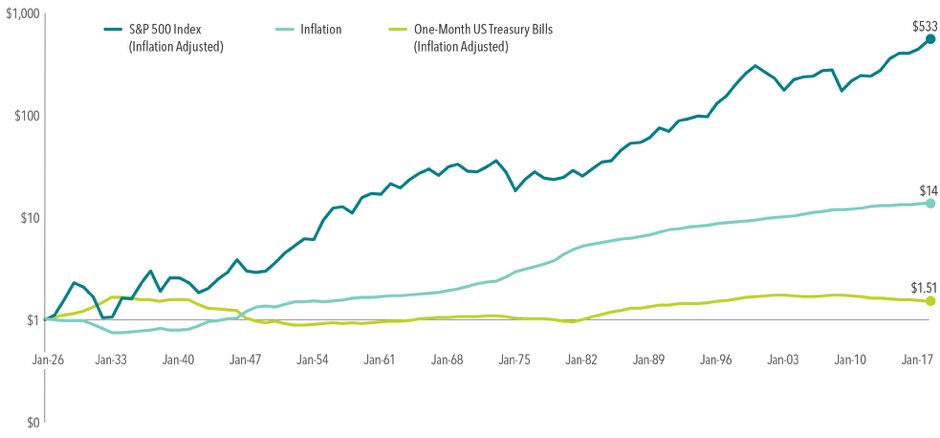 S&P and Dow Jones data © 2018 Dow Jones Indices LLC, a division of S&P Global. All rights reserved. Past performance is no guarantee of future results. Actual returns may be lower. Inflation is measured as changes in the US Consumer Price Index. While stocks are more volatile than T-bills, they have also been more likely to outpace inflation over long periods. The lesson here is that volatility is not the only type of risk that should concern investors. Ultimately, many investors may need to have some of their allocation in growth investments that outpace inflation to maintain their standard of living and grow their wealth. One additional tool available to investors who are concerned about both stock market volatility and inflation are Treasury Inflation-Protected Securities (TIPS). TIPS are guaranteed by the US Treasury and as such are considered by the marketplace to have low risk of default. The Treasury issues TIPS with a variety of maturities, and these securities are easily bought and sold. Unlike traditional Treasury securities such as T-bills, TIPS are indexed to inflation to protect investors from an erosion in purchasing power. As inflation (measured by the consumer price index) rises, so does the par value of TIPS, while the interest rate remains fixed. This means that if inflation unexpectedly rises, the purchasing power of any principal invested in TIPS should also increase.[1] Although they may not offer the long-term growth opportunities that stocks do, their structure makes TIPS an effective risk management tool for investors who are concerned with managing uncertainty around future purchasing power. Conclusion Inflation is an important consideration for many long-term investors. By combining the right mix of growth and risk management assets, investors may be able to blunt the effects of inflation and grow their wealth over time. Remember, however, that inflation is only one consideration among many that investors must contend with when building a portfolio for the future. The right mix of assets for any investor will depend upon that investor’s unique goals and needs. A financial advisor can help investors weigh the impact of inflation and other important considerations when preparing and investing for the future. [1]. Market prices incorporate market participants’ expectations about the future. Therefore, market participants’ expectations about future inflation should be incorporated into current prices. These expectations are referred to as expected inflation. Unexpected inflation refers to unexpected changes in inflation that deviate from prior market expectations. Unexpected inflation should be considered a primary driver of inflation risk.
Source: Dimensional Fund Advisors LP. Past performance is not a guarantee of future results. Indices are not available for direct investment. Their performance does not reflect the expenses associated with the management of an actual portfolio. There is no guarantee investment strategies will be successful. Investing involves risks including possible loss of principal. Investors should talk to their financial advisor prior to making any investment decision. There is always the risk that an investor may lose money. A long-term investment approach cannot guarantee a profit. All expressions of opinion are subject to change. This article is distributed for informational purposes, and it is not to be construed as an offer, solicitation, recommendation, or endorsement of any particular security, products, or services. Investors should talk to their financial advisor prior to making any investment decision. Few Equity Funds Have Survived and Outperformed Performance periods ending December 31, 2017  Disappearing Funds The size of the mutual fund landscape masks the fact that many funds disappear each year, often due to poor investment performance. Investors may be surprised by how many mutual funds become obsolete over time. About half of the equity and fixed income funds were no longer available after 15 years. Including these non-surviving funds in the sample is an important part of assessing mutual fund manager performance. The evidence suggests that only a low percentage of funds in the original sample were “winners”—defined as those that both survived and outperformed benchmarks. Both survival and outperformance rates tended to fall as the time horizon expands. For the 15‑year period through 2017, only 14% of equity funds survived and outperformed their benchmarks. Few Fixed Income Funds Have Survived and Outperformed Fixed income fund performance periods ending December 31, 2017  This chart shows survivorship and outperformance for fixed income funds. Their survival rates were similar to those of equities for the same 5-, 10-, and 15-year periods. Over time, a declining percentage of fixed income funds from the beginning sample survived, and only a fraction of those surviving funds delivered winning performance. For the 15-year period through 2017, only 13% of fixed income funds survived and outperformed their benchmarks. Past Performance Is Not Enough to Predict Future Results Percentage of funds that were top-quartile performers in consecutive three-year period 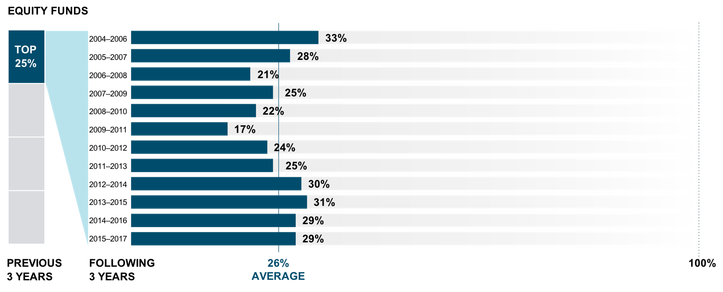 The Search for Persistence Some investors may resort to using track records as a guide to selecting funds, reasoning that a manager’s past success is likely to continue in the future. Does this assumption pay off? The research offers evidence to the contrary. The exhibit shows that among funds ranked in the top quartile (25%) based on previous three-year returns, a minority also ranked in the top quartile of returns over the following three-year period. This lack of persistence casts further doubt on the ability of managers to consistently gain an informational advantage on the market. For example, in 2017, only 29% of equity funds were ranked in the top quartile of performance in their category in both the previous period (2012–2014) and subsequent period (2015–2017). Over the 12 years through 2017, top-quartile persistence of three-year performers averaged 26% for equity funds. Some fund managers might be better than others, but track records alone may not provide enough insight to identify management skill. Stock and bond returns contain a lot of noise, and impressive track records may result from good luck. The assumption that strong past performance will continue often proves faulty, potentially leaving many investors disappointed. Conclusion The results of this study suggest that investors are best served by relying on market prices. Investment methods based on a manager’s ability to outguess market prices have resulted in underperformance for the vast majority of mutual funds. Despite the evidence, many investors continue searching for winning mutual funds and look to past performance as the main criterion for evaluating a manager’s future potential. In their pursuit of returns, many investors surrender performance to high fees, high turnover, and other costs of owning the mutual funds. We believe the underperformance of most US mutual funds highlights an important investment principle: The capital markets do a good job of pricing securities, which intensifies a fund’s challenge to beat its benchmark and other market participants. When fund managers charge high fees and trade frequently, they must overcome high cost barriers as they try to outperform the market. Choosing a long-term winner involves more than seeking out funds with a successful track record, as past performance offers no guarantee of a successful investment outcome in the future. Moreover, looking at past performance is only one way to evaluate a manager. In the end, investors should consider other aspects of a mutual fund, such as underlying market philosophy, robustness in portfolio design, and attention to total costs, all of which are important to delivering a good investment experience and, ultimately, helping investors achieve their goals. Data Appendix
Equity Funds: The sample includes funds at the beginning of the 5-, 10-, and 15-year periods ending December 31, 2017. Survivors are funds that had returns for every month in the sample period. Winners are funds that survived and outperformed their respective Morningstar category index over the period. US-domiciled open-end mutual fund data is from Morningstar and Center for Research in Security Prices (CRSP) from the University of Chicago.. Fixed Income Funds: The sample includes funds at the beginning of the 5-, 10-, and 15-year periods ending December 31, 2017. Survivors are funds that had returns for every month in the sample period. Winners are funds that survived and outperformed their respective Morningstar category index over the period. US-domiciled open-end mutual fund data is from Morningstar and Center for Research in Security Prices (CRSP) from the University of Chicago. Past Performance and Future Results: At the end of each year, funds are sorted within their category based on their three-year total return. The tables show the percentage of funds in the top quartile (25%) of three-year performance that ranked in the top quartile of performance over the following three years. Example: For 2017, only 29% of equity funds were ranked in the top quartile of performance in their category in both the previous period (2012–2014) and subsequent period (2015–2017). US-domiciled open-end mutual fund data is from Morningstar and Center for Research in Security Prices (CRSP) from the University of Chicago. The Mutual Fund Landscape study is conducted by Dimensional Fund Advisors LP. US-domiciled open-end mutual fund data is from Morningstar and Center for Research in Security Prices (CRSP) from the University of Chicago. Equity fund sample includes the Morningstar historical categories: Diversified Emerging Markets, Europe Stock, Foreign Large Blend, Foreign Large Growth, Foreign Large Value, Foreign Small/Mid Blend, Foreign Small/Mid Growth, Foreign Small/Mid Value, Japan Stock, Large Blend, Large Growth, Large Value, Mid-Cap Blend, Mid-Cap Growth, Mid-Cap Value, Miscellaneous Region, Pacific/Asia ex-Japan Stock, Small Blend, Small Growth, Small Value, and World Stock. For additional information regarding the Morningstar historical categories, please see “The Morningstar Category Classifications” at morningstardirect.morningstar.com/clientcomm/Morningstar_Categories_US_April_2016.pdf. Fixed income fund sample includes the Morningstar historical categories: Corporate Bond, High Yield Bond, Inflation-Protected Bond, Intermediate Government, Intermediate-Term Bond, Muni California Intermediate, Muni California Long, Muni Massachusetts, Muni Minnesota, Muni National Intermediate, Muni National Long, Muni National Short, Muni New Jersey, Muni New York Intermediate, Muni New York Long, Muni Ohio, Muni Pennsylvania, Muni Single State Intermediate, Muni Single State Long, Muni Single State Short, Short Government, Short-Term Bond, Ultrashort Bond, and World Bond. For additional information regarding the Morningstar historical categories, please see “The Morningstar Category Classifications” at morningstardirect.morningstar.com/clientcomm/Morningstar_Categories_US_April_2016.pdf. Index funds and fund-of-funds are excluded from the sample. Net assets for funds with multiple share classes or feeder funds are a sum of the individual share class total net assets. The return, expense ratio, and turnover for funds with multiple share classes are taken as the asset-weighted average of the individual share class observations. Fund share classes are aggregated at the strategy level using Morningstar FundID and CRSP portfolio number. Each fund is evaluated relative to the Morningstar benchmark assigned to the fund’s category at the start of the evaluation period. So, if, for example, a fund changes from Large Value to Large Growth during the evaluation period, then its return will still be compared to the Large Value category index. Surviving funds are those with return observations for every month of the sample period. Winner funds are those that survived and whose cumulative net return over the period exceeded that of their respective Morningstar category index. Loser funds are funds that did not survive the period or whose cumulative net return did not exceed their respective Morningstar category index. Index data provided by Bloomberg Barclays, MSCI, Russell, FTSE Fixed Income LLC, and S&P Dow Jones Indices. Bloomberg Barclays data provided by Bloomberg. MSCI data © MSCI 2018, all rights reserved. Frank Russell Company is the source and owner of the trademarks, service marks, and copyrights related to the Russell Indexes. FTSE fixed income indices © 2018 FTSE Fixed Income LLC, all rights reserved. S&P and Dow Jones data © 2018 S&P Dow Jones Indices LLC, a division of S&P Global. Indices are not available for direct investment. Their performance does not reflect the expenses associated with management of an actual portfolio. Mutual fund investment values will fluctuate, and shares, when redeemed, may be worth more or less than original cost. Diversification neither assures a profit nor guarantees against a loss in a declining market. There is no guarantee investment strategies will be successful. Past performance is no guarantee of future results. I get a lot of questions about income distribution during retirement. How much can I take? How should my assets be positioned? What types of assets produce the most income? Total return income planning is a holistic approach that takes into consideration your entire portfolio, focusing on the primary drivers of investment growth. 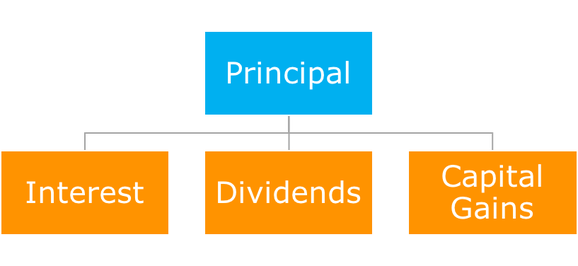 The Determinants of Return Obviously, we want our investment to grow over time. The principal we contribute, either initially or periodically through the years serves as the basis for future growth. Return on investment is determined by the combination of interest received from fixed income instruments (bonds, cd’s, money market accounts), stock profit sharing (otherwise known as dividends) and lastly by the gains or appreciation in value. When the time comes to begin generating income from investments, a total return approach looks holistically at the entire picture to systematically deliver an ongoing income stream. Income Requirements First, it’s essential to determine how much income is required, a question that cannot be answered without financial planning/analysis. In one form or another, it begins with figuring out expenses and cost of living during retirement. Next, comes integrating any recurring income from social security, pensions, annuities, etc. The difference between those two numbers represents a basic estimate of the income replacement needed from other investments. The simplicity of this example should not understate the potentially significant impact of things like taxation, inflation, and other estate planning considerations. The next question: Can the principal value of my portfolio plus its future growth through interest, dividends and capital appreciation (i.e. total return) make up the difference? Answer: “It depends.” Total return income planning incorporates a future expected rate of return to a portfolio which is further defined as “all investment accounts and their overall allocation to equity/stock and fixed income/bonds.” Lots of considerations come into play such as the total value, the equity to fixed income ratio; risk/return characteristics etc. Behavior can also have an impact on returns. Therefore, none of these points matter if the portfolio doesn’t fit with the investor's risk tolerance. The Act of Creating Income To supplement the need for income, cash is made available on a periodic basis (usually monthly, quarterly, or annually), by placing trades in one or a variety of the accounts. Tax efficiency is often stressed when determining whether the funds come from Traditional IRA’s, 401(k)’s, Roth IRA’s, taxable Individual/Joint Brokerage accounts or a combination thereof. The process of creating an ongoing income stream continues by following the same steps to replenish the funds needed for living expenses. It’s important to remember that today’s money won’t buy the same amount of goods/services as it will 10 years from now. Therefore, funds not required for current living expenses are efficiently left to grow in order to satisfy future inflation-adjusted income needs. Conclusion Growth and income may be the two most ambiguous financial terms that get thrown around. Total return essentially represents the most holistic incorporation of both. It provides the flexibility for both tax efficient distribution and unforeseen income needs. It also presents the opportunity to reduce cost, as opposed to many accurately maligned investment products containing multiple layers of hard-to-find fees and expenses. All data is from sources believed to be reliable but cannot be guaranteed or warranted. This information is intended for educational purposes, and it is not to be construed as an offer, solicitation, recommendation, or endorsement of any particular security, products, or services. No one should assume that any discussion or information contained in this material serves as a receipt of, or as a substitute for, personalized investment, tax or legal advice. Diversification does not eliminate the risk of market loss. Investment risks include loss of principal and fluctuating value. Past performance is not a guarantee of future results. Indices are not available for direct investment; therefore, their performance does not reflect the expenses associated with the management of an actual portfolio.
Check out this outstanding video illustrating the dangers of paying too much attention to financial media pundits. This comes from our partners at DFA, a company as dedicated to research and empirical evidence as we are.
Throughout 2017, the S&P 500 Index recorded 62 new closing highs in 251 days of trading. In the first three weeks of January 2018 alone, the index crossed 10 new record closing highs in 13 days of trading. With stock indices continuing to set new highs, does this mean negative returns for stocks are on the horizon? When addressing this question, it is helpful to keep the following in mind:
History can help illustrate this point and show us that a market index reaching an all-time high has not necessarily provided actionable information for investors. Exhibit 1. S&P 500 Index Total Return Highs Percent of cases where index is higher after monthly closing high vs. any monthly closing level January 1926–December 2017 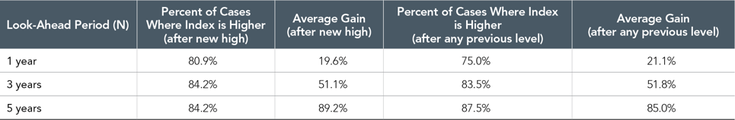 For illustrative purposes only. Average gain is a simple average of all positive returns for the 1-, 3-, or 5-year periods analyzed. © 2018 S&P Dow Jones Indices LLC, a division of S&P Global. All rights reserved. Exhibit 1 measures monthly closing levels of the S&P 500 Index from the beginning of 1926 to the end of 2017. Of the 1,103 months observed, almost one-third represented new closing highs for the index. This may not be surprising for some. Since markets generally tend to go up over time, new highs should be a relatively common occurrence. Considering this, it is worth posing the question: If prices increasing over time was a troubling development, what would be the point of investing at all? This data also shows that looking ahead on a one-, three-, and five-year basis, the percent of cases when the index was higher or lower after a new market high is about the same when compared to any other previous price level. In other words, positive and negative returns tended to make up a similar proportion of returns after the fact, regardless of whether a new high was reached or not. For example, for a three-year look-ahead period, the index was higher around 84% of the time both after hitting a new closing high as well as after any other previous level. Additionally, this data shows us that the average return experienced after those highs vs. any other level is also quite similar. For example, for the three-year look-ahead period, the average cumulative return after a new high was 51.1% vs. 51.8% for any other level. These results indicate that new index highs have historically not been useful predictors of future returns. Another reason investors should be cautious about reevaluating their approach at an all-time high is the potential opportunity cost of switching in and out of the market. Last year, the S&P 500 Index returned more than 20%, and yet 2017 started with three new market highs during the first 20 trading sessions.[1] The opportunity cost paid by investors reacting to the new highs by selling stocks could have been substantial. There is no reliable way to predict when stock returns will be positive or negative, and while the long-term average return of the US stock market[2] has been around 10% since 1926, year-to-year results often deviate markedly from the historical average.[3] Investors looking to capture what the equity markets offer over the long term are likely well served by sticking with their approach rather than making changes based on short-term noise. Conclusion The question of whether new market highs portend a fall in stocks can often be translated to another, more general question: “Is now a good time for me to be invested?” The evidence suggests that the current state of the market is not helpful in answering this question. Rather, an appropriate answer is highly dependent upon an investor’s unique situation and their risk and return objectives. For investors concluding stock market exposure is appropriate, a disciplined approach with a long-term view is likely a more prudent course of action than reacting to new market highs. Source: Dimensional Fund Advisors LP. Indices are not available for direct investment. Their performance does not reflect the expenses associated with the management of an actual portfolio. Past performance is not a guarantee of future results. Diversification does not eliminate the risk of market loss. There is no guarantee investment strategies will be successful. Investing involves risks including possible loss of principal. Investors should talk to their financial advisor prior to making any investment decision. There is always the risk that an investor may lose money. A long-term investment approach cannot guarantee a profit. All expressions of opinion are subject to change. This article is distributed for informational purposes, and it is not to be construed as an offer, solicitation, recommendation, or endorsement of any particular security, products, or services. Investors should talk to their financial advisor prior to making any investment decision. [1]. S&P 500 Index data © 2018 Dow Jones Indices LLC, a division of S&P Global. All rights reserved. [2] As measured by the S&P 500 Index. [3]. For more on this topic, please see “The Uncommon Average” from October 2017. In 2017, we were again reminded of the importance of following an investment approach based on discipline and diversification vs. prediction and timing. As we gear up for the new year, we can look at several examples during 2017 that provide perspective on what guidance investors may want to follow, or not follow, in order to achieve the long-term return the capital markets offer. NINE EXPERTS Each January, a well-known financial publication invites a group of experienced investment professionals to New York for a lengthy roundtable discussion of the investment outlook for the year ahead. The nine panelists have spent their careers studying companies and poring over economic statistics to find the most rewarding investment opportunities around the globe. Ahead of 2017, the authors of the publication’s report were struck by the “remarkably cohesive consensus” among the members of the group, who often find much to disagree about. Not one pro expressed strong enthusiasm for US stocks in the year ahead, two expected returns to be negative for the year, and the most optimistic forecast was for a total return of 7%. They also found little to like in global markets, citing “gigantic geopolitical issues,” including a Chinese “debt bubble” and a “crisis” in the Italian banking system. The excerpts below summarizing the panel’s outlook presented a less than optimistic view of the year ahead in January 2017. “This could be the year when the movie runs backwards: Inflation awakens. Bond yields reboot. Stocks stumble. Active management rules. And we haven’t even touched on the coming regime change in Washington.”1 The outcome of these predictions: Zero-for-four, although some might point out that at least they got the direction right regarding the inflation rate.
on a consistent basis. FOUR SURPRISES
THE MILLION DOLLAR BET Last year saw the conclusion of a 10-year wager between Warren Buffett, chairman of Berkshire Hathaway Inc., and Ted Seides, a New York hedge fund consultant. Seides responded to a public challenge issued by Buffett in 2007 regarding the merits of hedge funds relative to low-cost passive vehicles. The two men agreed to bet $1 million on the outcome of their respective investment strategies over the 10-year period from January 1, 2008, through December 31, 2017. Buffett selected the S&P 500 Index, Seides selected five hedge funds, and the stakes were earmarked for the winner’s preferred charity. The terms were revised midway through the period by converting the sum invested in bonds to Berkshire Hathaway shares, so the final amount is reported to be in excess of $2.2 million. The 10-year period included years of dramatic decline for the S&P 500 Index (–37.0% in 2008) as well as above-average gains (+32.4% in 2013), so there was ample opportunity for clever managers to attempt to outperform a buy-and-hold strategy through a successful timing strategy. For fans of hedge funds, however, the results were not encouraging. For the nine-year period from January 1, 2008, through December 31, 2016, the average of the five funds achieved a total return of 22.0% compared to 85.5% for the S&P 500 Index.12 (Results for 2017 have not yet been reported.) Having fallen far behind after nine years, Seides graciously conceded defeat in mid-2017. But he pointed out in a May 2017 Bloomberg article that in the first 14 months of the bet, the S&P 500 Index declined roughly 50% while his basket of hedge funds declined less than half as much. He suggested that many investors bailed out of their S&P 500-type strategies in 2008 and never participated in the recovery. Hedge fund participants, he argued, “stood a much better chance of staying the course.” Seides makes a valid point—long run returns don’t matter if the strategy is abandoned along the way. And there is ample evidence that some mutual fund investors sold in late 2008 and missed out on substantial subsequent gains. But do hedge funds offer the best solution to this problem? We think educating investors about the unpredictability of capital market returns and the importance of appropriate asset allocation will likely prove more fruitful than paying fees to guess where markets are headed next. A hypothetical global diversified allocation of 60% equities and 40% fixed income13 still outperformed the hedge fund basket over the same nine years (56.6% vs. 22.0% in total returns). Over any time period some managers will outperform index-type strategies, although most research studies find that the number is no greater than we would expect by chance. Advocates of active management often claim that this evidence does not concern them, since superior managers can be identified in advance by conducting a thorough assessment of manager skills. But this 10-year challenge offers additional evidence that investors will most likely find such efforts fail to improve their investment experience. EXPECT THE UNEXPECTED Financial markets surprised many investors in 2017, but then again they have a long history of surprising investors. For example, from 1926–2017, the annualized return for the S&P 500 Index was 10.2%. But returns in any single year were seldom close to this figure. They fell in a range between 8% and 12% only six times in the last 92 years but experienced gains or losses greater than 20% 40 times (34 gains, six losses). Investors should appreciate that many times realized returns may be far different from expected returns. For a number of investors, 2017 was a paradox. The harder they tried to enhance their results by paying close attention to current events, the more likely they failed to capture the rate of return the capital markets offered. New Year’s resolution: Keep informed on current events as a responsible citizen. Let the capital markets decide where returns will be generated. APPENDIX Article By Weston Wellington- Vice President, Dimensional Fund Advisors Dimensional 60/40 Balanced Strategy Index Rebalanced monthly. For illustrative purposes only. The balanced strategy index is not a recommendation for an actual allocation. All performance results are based on performance of indices with model/backtested asset allocations; the performance was achieved with the benefit of hindsight; it does not represent actual investment strategies, nor does it reflect fees associated with investing. Actual results may vary significantly. The underlying Dimensional indices of the balanced strategy index have been retrospectively calculated by Dimensional Fund Advisors LP and did not exist prior to their inceptions dates. Other periods selected may have different results, including losses. Backtested index performance is hypothetical, is not actual performance and is provided for informational purposes only. Backtested performance results assume the reinvestment of dividends and capital gains. Additional information is available upon request. 1. Lauren R. Rublin, “Stocks Could Post Limited Gains in 2017 as Yields Rise,” Barron’s, January 14, 2017. 2. Inflation data © 2018 and earlier, Morningstar. All rights reserved. Underlying data provided by Ibbotson Associates via Morningstar Direct. 3. As measured by the MSCI All Country World IMI Index (net dividends). 4. Adam Shell, “How Will Stocks Make Out in 2017?” USA TODAY, December 24, 2016. 5. S&P data © 2018 S&P Dow Jones Indices LLC, a division of S&P Global. All rights reserved. 6. As measured by the MSCI Korea IMI Index (net dividends). MSCI data © MSCI 2018, all rights reserved. 7. Jonathan R. Laing, “China’s Debt Addiction Could Lead to Financial Crisis,” Barron’s, November 5, 2016. 8. As measured by the MSCI China IMI Index (net dividends). MSCI data © MSCI 2018, all rights reserved. 9. Neal E. Boudette, “Car Sales End a 7 Year Upswing, With More Challenges Ahead,” New York Times, January 3, 2018. 10. Steven Russolillo, “Yellow Flag Waves Over Auto Stocks,” Wall Street Journal, January 4, 2017. 11. Ford Motor, General Motors, and Fiat Chrysler returns provided by Bloomberg Finance LP. 12. Hedge fund data from Chairman’s Letter, Berkshire Hathaway Inc. 2016 annual report. 13. Global diversified allocation is the Dimensional 60/40 Balanced Strategy Index. Indices cannot be invested into directly. See Appendix for index description. Past performance is no guarantee of future investment results S&P data © 2018 S&P Dow Jones Indices LLC, a division of S&P Global. All rights reserved. Past performance is no guarantee of future investment results. Indices are not available for direct investment; therefore, their performance does not reflect the expenses associated with the management of an actual portfolio. Diversification does not eliminate the risk of market loss. There is no guarantee an investment strategy will be successful. Any specific stock reference is provided for illustrative purposes only and is not a recommendation of any specific security. All expressions of opinion are subject to change. This article is distributed for informational purposes, and it is not to be construed as an offer, solicitation, recommendation, or endorsement of any particular security, products, or services. Dimensional Fund Advisors LP is an investment advisor registered with the Securities and Exchange Commission. The last days of the year produced the most significant tax overhaul in decades, with far-reaching ramifications for most investors. Originally intended to be a simplification of the tax code, the bill turned out to be a series of tweaks and adjustments to both personal and corporate income taxes for 2018. While it is always advisable to consult your tax professional on these changes, here is a brief summary of how the bill impacts taxpayers. 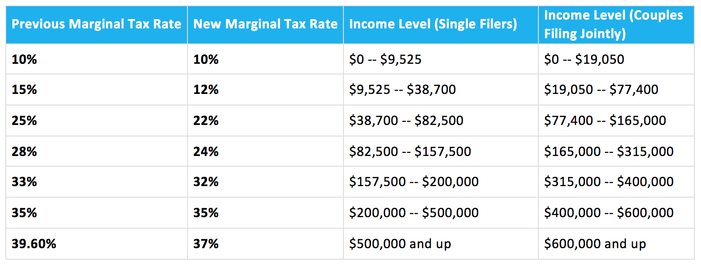
Market Summary News of tax reform didn’t overshadow another strong year for markets. Major equity asset classes around the globe all posted double digit gains. Emerging markets led the way +37.28% for the year. International Developed markets were up +25%. The S&P 500 posted another great year +21.83% and US small caps gained 14.65%. US Bond markets also fared reasonably well, turning in a positive 3.54% return. 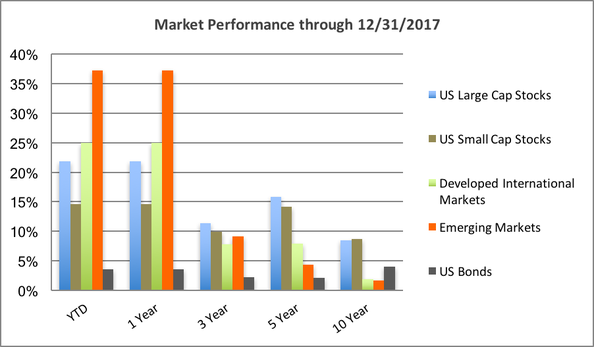 Last year around this time all the buzz was about the United Kingdom's vote to leave the European Union, the surprise election of Donald Trump, and how global markets would respond. One could have easily made the argument that such uncertainty would have had a negative impact. Now that the results are in, talk turns to whether stocks are overpriced or underpriced and how much longer this bull market can continue. The fact of the matter is, predicting the next bear market isn’t necessary for the success of long term diversified investors. Most of us will see numerous bull/bear market cycles throughout our investment lifetime (We’ve seen 5 changes in the last 27 years.) Things like behavioral discipline, rebalancing, and making intelligent financial planning decisions are always going to be far more important to long term success. WealthShape, LLC provides this communication as a matter of general information. No one should assume that any discussion or information contained in this material serves as a receipt of, or as a substitute for, personalized investment, tax or legal advice. Bitcoin and other cryptocurrencies are receiving intense media coverage, prompting many investors to wonder whether these new types of electronic money deserve a place in their portfolios. Cryptocurrencies such as bitcoin emerged only in the past decade. Unlike traditional money, no paper notes or metal coins are involved. No central bank issues the currency, and no regulator or nation state stands behind it. Instead, cryptocurrencies are a form of code made by computers and stored in a digital wallet. In the case of bitcoin, there is a finite supply of 21 million,[1] of which more than 16 million are in circulation.[2] Transactions are recorded on a public ledger called blockchain. People can earn bitcoins in several ways, including buying them using traditional fiat currencies[3] or by “mining” them—receiving newly created bitcoins for the service of using powerful computers to compile recent transactions into new blocks of the transaction chain through solving a highly complex mathematical puzzle. For much of the past decade, cryptocurrencies were the preserve of digital enthusiasts and people who believe the age of fiat currencies is coming to an end. This niche appeal is reflected in their market value. For example, at a market value of $16,000 per bitcoin,[4] the total value of bitcoin in circulation is less than one tenth of 1% of the aggregate value of global stocks and bonds. Despite this, the sharp rise in the market value of bitcoins over the past weeks and months have contributed to intense media attention. What are investors to make of all this media attention? What place, if any, should bitcoin play in a diversified portfolio? Recently, the value of bitcoin has risen sharply, but that is the past. What about its future value? You can approach these questions in several ways. A good place to begin is by examining the roles that stocks, bonds, and cash play in your portfolio. EXPECTED RETURNS Companies often seek external sources of capital to finance projects they believe will generate profits in the future. When a company issues stock, it offers investors a residual claim on its future profits. When a company issues a bond, it offers investors a promised stream of future cash flows, including the repayment of principal when the bond matures. The price of a stock or bond reflects the return investors demand to exchange their cash today for an uncertain but greater amount of expected cash in the future. One important role these securities play in a portfolio is to provide positive expected returns by allowing investors to share in the future profits earned by corporations globally. By investing in stocks and bonds today, you expect to grow your wealth and enable greater consumption tomorrow. Government bonds often provide a more certain repayment of promised cash flows than corporate bonds. Thus, besides the potential for providing positive expected returns, another reason to hold government bonds is to reduce the uncertainty of future wealth. And inflation-linked government bonds reduce the uncertainty of future inflation-adjusted wealth. Holding cash does not provide an expected stream of future cash flow. One US dollar in your wallet today does not entitle you to more dollars in the future. The same logic applies to holding other fiat currencies — and holding bitcoins in a digital wallet. So we should not expect a positive return from holding cash in one or more currencies unless we can predict when one currency will appreciate or depreciate relative to others. The academic literature overwhelmingly suggests that short-term currency movements are unpredictable, implying there is no reliable and systematic way to earn a positive return just by holding cash, regardless of its currency. So why should investors hold cash in one or more currencies? One reason is because it provides a store of value that can be used to manage near-term known expenditures in those currencies. With this framework in mind, it might be argued that holding bitcoins is like holding cash; it can be used to pay for some goods and services. However, most goods and services are not priced in bitcoins. A lot of volatility has occurred in the exchange rates between bitcoins and traditional currencies. That volatility implies uncertainty, even in the near term, in the amount of future goods and services your bitcoins can purchase. This uncertainty, combined with possibly high transaction costs to convert bitcoins into usable currency, suggests that the cryptocurrency currently falls short as a store of value to manage near-term known expenses. Of course, that may change in the future if it becomes common practice to pay for all goods and services using bitcoins. If bitcoin is not currently practical as a substitute for cash, should we expect its value to appreciate? SUPPLY AND DEMAND The price of a bitcoin is tied to supply and demand. Although the supply of bitcoins is slowly rising, it may reach an upper limit, which might imply limited future supply. The future supply of cryptocurrencies, however, may be very flexible as new types are developed and innovation in technology makes many cryptocurrencies close substitutes for one another, implying the quantity of future supply might be unlimited. Regarding future demand for bitcoins, there is a non‑zero probability[5] that nothing will come of it (no future demand) and a non-zero probability that it will be widely adopted (high future demand). Future regulation adds to this uncertainty. While recent media attention has ensured bitcoin is more widely discussed today than in years past, it is still largely unused by most financial institutions. It has also been the subject of scrutiny by regulators. For example, in a note to investors in 2014, the US Securities and Exchange Commission warned that any new investment appearing to be exciting and cutting-edge has the potential to give rise to fraud and false “guarantees” of high investment returns.[6] Other entities around the world have issued similar warnings. It is unclear what impact future laws and regulations may have on bitcoin’s future supply and demand (or even its existence). This uncertainty is common with young investments. All of these factors suggest that future supply and demand are highly uncertain. But the probabilities of high or low future supply or demand are an input in the price of bitcoins today. That price is fair, in that investors willingly transact at that price. One investor does not have an unfair advantage over another in determining if the true probability of future demand will be different from what is reflected in bitcoin’s price today. WHAT TO EXPECT So, should we expect the value of bitcoins to appreciate? Maybe. But just as with traditional currencies, there is no reliable way to predict by how much and when that appreciation will occur. We know, however, that we should not expect to receive more bitcoins in the future just by holding one bitcoin today. They don’t entitle holders to an expected stream of future bitcoins, and they don’t entitle the holder to a residual claim on the future profits of global corporations. None of this is to deny the exciting potential of the underlying blockchain technology that enables the trading of bitcoins. It is an open, distributed ledger that can record transactions efficiently and in a verifiable and permanent way, which has significant implications for banking and other industries, although these effects may take some years to emerge. When it comes to designing a portfolio, a good place to begin is with one’s goals. This approach, combined with an understanding of the characteristics of each eligible security type, provides a good framework to decide which securities deserve a place in a portfolio. For the securities that make the cut, their weight in the total market of all investable securities provides a baseline for deciding how much of a portfolio should be allocated to that security. Unlike stocks or corporate bonds, it is not clear that bitcoins offer investors positive expected returns. Unlike government bonds, they don’t provide clarity about future wealth. And, unlike holding cash in fiat currencies, they don’t provide the means to plan for a wide range of near-term known expenditures. Because bitcoin does not help achieve these investment goals, we believe that it does not warrant a place in a portfolio designed to meet one or more of such goals. If, however, one has a goal not contemplated herein, and you believe bitcoin is well suited to meet that goal, keep in mind the final piece of our asset allocation framework: What percentage of all eligible investments do the value of all bitcoins represent? When compared to global stocks, bonds, and traditional currency, their market value is tiny. So, if for some reason an investor decides bitcoins are a good investment, we believe their weight in a well-diversified portfolio should generally be tiny.[7] Because bitcoin is being sold in some quarters as a paradigm shift in financial markets, this does not mean investors should rush to include it in their portfolios. When digesting the latest article on bitcoin, keep in mind that a goals-based approach based on stocks, bonds, and traditional currencies, as well as sensible and robust dimensions of expected returns, has been helping investors effectively pursue their goals for decades. Source: Dimensional Fund Advisors LP.
The opinions expressed are those of the author and are subject to change. The commentary above pertains to bitcoin cryptocurrency. Certain bitcoin offerings may be considered a security and may have different attributes than those described in this paper. Dimensional does not offer bitcoin. This material is not to be construed as investment advice or a recommendation to buy or sell any security or currency. Investing involves risks including possible loss of principal. Stocks are subject to market fluctuation and other risks. Bonds are subject to increased risk of loss of principal during periods of rising interest rates and other risks. There is no assurance that any investment strategy will be successful. Diversification does not assure a profit or protect against loss. [1]. Source: Bitcoin.org. [2]. As of December 14, 2017. Source: Coinmarketcap.com. [3]. A currency declared by a government to be legal tender. [4]. Per Bloomberg, the end-of-day market value of a bitcoin exceeded $16,000 USD for the first time on December 7, 2017. [5]. Describes an outcome that is possible (or not impossible) to occur. [6]. “Investor Alert: Bitcoin and Other Virtual Currency-Related Investments,” SEC, 7 May 2014. [7]. Investors should discuss the risks and other attributes of any security or currency with their advisor prior to making any investment. The most powerful driving force behind free and open capital markets has historically been the dissemination, consumption and interpretation of news. Since the inception of public news consumption, misinformation has been an issue. Different terminology comes and goes, “fake news” being the latest label, magnified by the president’s usage of it. Today, in an era when fact checking through multiple sources seems low on the list of journalistic priorities, have we reached a point where an impact can be felt from the publication of fake news? Recently, ABC News anchor Brian Ross reported that former National Security Advisor Michael Flynn was prepared to testify that during the campaign Donald Trump had personally directed him to make contact with Russians. Following his on-air statement, ABC News tweeted about the report which subsequently received 25,000 retweets. As you can imagine, word began spreading like wildfire to most of the major media outlets, many crediting ABC News for breaking the story. However, there was one minor problem. It happened to be false. Effects came quickly as investors and by extension financial markets began interpreting the future implications of this new development. Ross’s live TV broadcast took place at approximately 11:00 AM eastern time, by 11:30 the Dow Jones Industrial Average reacted sharply, falling around 350 points. 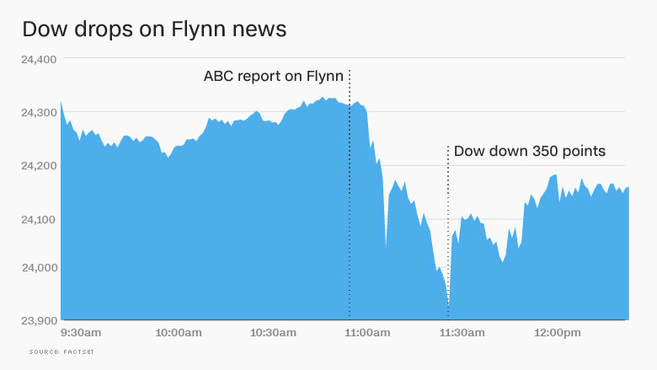 Interestingly enough Michael Flynn wasn’t the days only headline news. December 1st also included initial signals that the much talked about tax reform bill had enough votes to pass in the Senate. By market close, the Dow had recovered most of the day’s losses finishing just 41 points lower than the previous day. It wasn’t until later that day when ABC issued an apology in addition to suspending Ross 4 weeks for his inaccurate reporting:
"We deeply regret and apologize for the serious error we made yesterday. The reporting conveyed by Brian Ross during the special report had not been fully vetted through our editorial standards process," ABC said in a statement. "As a result of our continued reporting over the next several hours ultimately we determined the information was wrong and we corrected the mistake on air and online." Fortunately, or unfortunately we live in a 24-hour news cycle. With the current volume of sensationalized, half-baked journalism out there, it’s understandable for markets to react irrationally at times. The events of December 1st are a reminder that short-term volatility or “noise” as the pundits like to call it, is often a factor when news is being interpreted. In this instance, markets reversed course quickly, incorporating the newly released information into prices. Headlines often jolt us, perhaps even more regularly than we care to admit. Does fake news impact the market? The answer would have to be yes…but then again, all varieties of news from stone cold factual journalism to supermarket tabloids have an impact. It’s critical to remember that although noise exists, markets tend to get things right over time. We should use these cases as opportunities to reflect on the larger body of evidence that supports disciplined long-term investing over emotional short-term speculation. Focusing on what you can control can lead to a better investment experience. Whether you’ve been investing for decades or are just getting started, at some point on your investment journey you’ll likely ask yourself some of the questions below. Trying to answer these questions may be intimidating, but know that you’re not alone. While this is not intended to be an exhaustive list it will hopefully shed light on a few key principles, using data and reasoning, that may help improve investors’ odds of investment success in the long run. 1. What sort of competition do I face as an investor? The market is an effective information-processing machine. Millions of market participants buy and sell securities every day and the real-time information they bring helps set prices. This means competition is stiff and trying to outguess market prices is difficult for anyone, even professional money managers (see question 2 for more on this). This is good news for investors though. Rather than basing an investment strategy on trying to find securities that are priced “incorrectly,” investors can instead rely on the information in market prices to help build their portfolios (see question 5 for more on this). 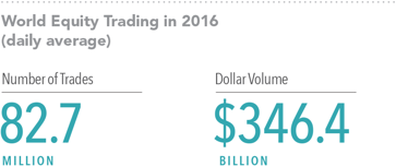 Source: World Federation of Exchanges members, affiliates, correspondents, and non-members. Trade data from the global electronic order book. Daily averages were computed using year-to-date totals as of December 31, 2016, divided by 250 as an approximate number of annual trading days. 2. What are my chances of picking an investment fund that survives and outperforms? Flip a coin and your odds of getting heads or tails are 50/50. Historically, the odds of selecting an investment fund that was still around 15 years later are about the same. Regarding outperformance, the odds are worse. The market’s pricing power works against fund managers who try to outperform through stock picking or market timing. One needn’t look further than real-world results to see this. Based on research*, only 17% of US equity mutual funds and 18% of fixed income funds have survived and outperformed their benchmarks over the past 15 years. 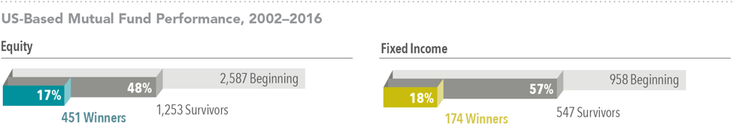 Source: *Mutual Fund Landscape 2017, Dimensional Fund Advisors. See Appendix for important details on the study. Past performance is no guarantee of future results. 3. If I choose a fund because of strong past performance, does that mean it will do well in the future? Some investors select mutual funds based on past returns. However, research shows that most funds in the top quartile (25%) of previous five-year returns did not maintain a top-quartile ranking in the following year. In other words, past performance offers little insight into a fund’s future returns. 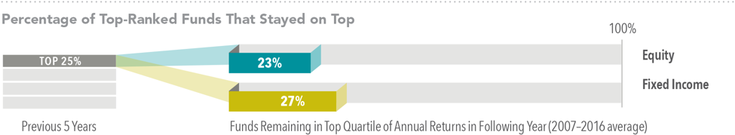 Source: *Mutual Fund Landscape 2017, Dimensional Fund Advisors. See Appendix for important details on the study. Past performance is no guarantee of future results. 4. Do I have to outsmart the market to be a successful investor? Financial markets have rewarded long-term investors. People expect a positive return on the capital they invest, and historically, the equity and bond markets have provided growth of wealth that has more than offset inflation. Instead of fighting markets, let them work for you. 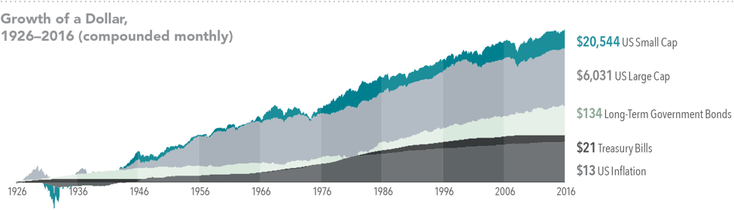 US Small Cap is the CRSP 6–10 Index. US Large Cap is the S&P 500 Index. Long-Term Government Bonds is the IA SBBI US LT Govt TR USD, provided by Ibbotson Associates via Morningstar Direct. Treasury Bills is the IA SBBI US 30 Day TBill TR USD, provided by Ibbotson Associates via Morningstar Direct. US Inflation is measured as changes in the US Consumer Price Index. US Consumer Price Index data is provided by the US Department of Labor Bureau of Labor Statistics. CRSP data is provided by the Center for Research in Security Prices, University of Chicago. The S&P data is provided by Standard & Poor’s Index Services Group. Indices are not available for direct investment. Index performance does not reflect the expenses associated with the management of an actual portfolio. Past performance is no guarantee of future results. 5. Is there a better way to build a portfolio? Academic research has identified these equity and fixed income dimensions, which point to differences in expected returns among securities. Instead of attempting to outguess market prices, investors can instead pursue higher expected returns by structuring their portfolio around these dimensions. 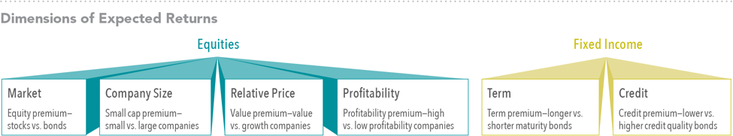 Relative price is measured by the price-to-book ratio; value stocks are those with lower price-to-book ratios. Profitability is a measure of current profitability based on information from individual companies’ income statements. 6. Is international investing for me? Diversification helps reduce risks that have no expected return, but diversifying only within your home market may not be enough. Instead, global diversification can broaden your investment opportunity set. By holding a globally diversified portfolio, investors are well positioned to seek returns wherever they occur. 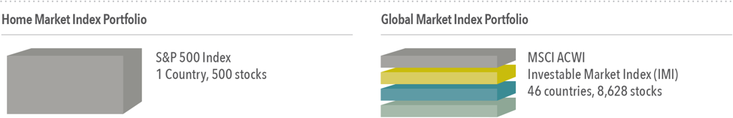 Number of holdings and countries for the S&P 500 Index and MSCI ACWI (All Country World Index) Investable Market Index (IMI) as of December 31, 2016. The S&P data is provided by Standard & Poor’s Index Services Group. MSCI data ©MSCI 2017, all rights reserved. International investing involves special risks such as currency fluctuation and political stability. Investing in emerging markets may accentuate those risks. Diversification does not eliminate the risk of market loss. Indices are not available for direct investment 7. Will making frequent changes to my portfolio help me achieve investment success? It’s tough, if not impossible, to know which market segments will outperform from period to period. Accordingly, it’s better to avoid market timing calls and other unnecessary changes that can be costly. Allowing emotions or opinions about short-term market conditions to impact long-term investment decisions can lead to disappointing results. 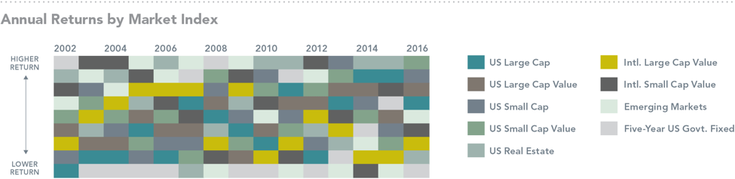 US Large Cap is the S&P 500 Index. US Large Cap Value is the Russell 1000 Value Index. US Small Cap is the Russell 2000 Index. US Small Cap Value is the Russell 2000 Value Index. US Real Estate is the Dow Jones US Select REIT Index. International Large Cap Value is the MSCI World ex USA Value Index (net dividends). International Small Cap Value is the MSCI World ex USA Small Cap Value Index (net dividends). Emerging Markets is the MSCI Emerging Markets Index (net dividends). Five-Year US Government Fixed is the Bloomberg Barclays US TIPS Index 1–5 Years. The S&P data is provided by Standard & Poor’s Index Services Group. Frank Russell Company is the source and owner of the trademarks, service marks, and copyrights related to the Russell Indexes. Dow Jones data provided by Dow Jones Indices. MSCI data ©MSCI 2017, all rights reserved. Bloomberg Barclays data provided by Bloomberg. Indices are not available for direct investment. Index performance does not reflect the expenses associated with the management of an actual portfolio. Past performance is no guarantee of future results. 8. Should I make changes to my portfolio based on what I’m hearing in the news? Daily market news and commentary can challenge your investment discipline. Some messages stir anxiety about the future, while others tempt you to chase the latest investment fad. If headlines are unsettling, consider the source and try to maintain a long-term perspective.  9. So, what should I be doing? Work closely with a financial advisor who can offer expertise and guidance to help you focus on actions that add value. Focusing on what you can control can lead to a better investment experience.
APPENDIX
Question 2: The sample includes US-based funds at the beginning of the 15-year period ending December 31, 2016. Each fund is evaluated relative to the Morningstar benchmark assigned to the fund’s category at the start of the evaluation period. Surviving funds are those with return observations for every month of the sample period. Winner funds are those that survived and whose cumulative net return over the period exceeded that of their respective Morningstar category benchmark. Question 3: At the end of each year, funds are sorted within their category based on their five-year total return. Funds in the top quartile (25%) of returns are evaluated again in the following year based on one-year performance in order to determine the percentage of funds that maintained a top-quartile ranking. The analysis is repeated each year from 2007–2016. The chart shows average persistence of top-quartile funds during the 10-year period. Questions 2 and 3: US-domiciled open-end mutual fund data is from Morningstar and Center for Research in Security Prices (CRSP) from the University of Chicago. Index funds and fund-of-funds are excluded from the sample. Equity fund sample includes the Morningstar historical categories: Diversified Emerging Markets, Europe Stock, Foreign Large Blend, Foreign Large Growth, Foreign Large Value, Foreign Small/Mid Blend, Foreign Small/Mid Growth, Foreign Small/Mid Value, Japan Stock, Large Blend, Large Growth, Large Value, Mid- Cap Blend, Mid-Cap Value, Miscellaneous Region, Pacific ex-Japan Stock, Small Blend, Small Growth, Small Value, and World Stock. Fixed income fund sample includes the Morningstar historical categories: Corporate Bond, Inflation-Protected Bond, Intermediate Government, Intermediate-Term Bond, Muni California Intermediate, Muni National Intermediate, Muni National Short, Muni New York Intermediate, Muni Single State Short, Short Government, Short-Term Bond, Ultrashort Bond, and World Bond. For additional information regarding the Morningstar historical categories, please see “The Morningstar Category Classifications”at morningstardirect.morningstar.com/clientcomm/Morningstar_Categories_US_April_2016.pdf. See Dimensional’s “Mutual Fund Landscape 2017” for more detail. Benchmark data provided by Bloomberg Barclays, MSCI, Russell, Citigroup, and S&P. Bloomberg Barclays data provided by Bloomberg. MSCI data © MSCI 2017, all rights reserved. Frank Russell Company is the source and owner of the trademarks, service marks, and copyrights related to the Russell Indexes. Citi fixed income indices © 2017 by Citigroup. The S&P data is provided by Standard & Poor’s Index Services Group. Source: Dimensional Fund Advisors LP. Indices are not available for direct investment. Their performance does not reflect the expenses associated with the management of an actual portfolio. Past performance is not a guarantee of future results. Diversification does not eliminate the risk of market loss. There is no guarantee investment strategies will be successful. Investing involves risks including possible loss of principal. Investors should talk to their financial advisor prior to making any investment decision. All expressions of opinion are subject to change. This article is distributed for informational purposes, and it is not to be construed as an offer, solicitation, recommendation, or endorsement of any particular security, products, or services. Investors should talk to their financial advisor prior to making any investment decision.  410 days…That’s all it took to create one of the seven wonders of the modern world. Over 3,000 masons, architects, steelworkers, and skilled laborers worked together on the Empire State Building. For nearly forty years it stood as the tallest building on earth, an undeniable example of efficiency, produced through the collective use of knowledge. It’s a simple concept that can be applied to just about any industry and it underpins the basic idea of why markets work. The functionality of financial markets, like any market, is based on open and ongoing participation in an environment where decisions are made based on an opinion of value. Market efficiency isn’t a new idea. The concept of exchange for equal or greater value is enshrined in our DNA. For every buyer, there must be a seller and vice versa. In order to execute a trade, each side has to at least initially feel like they’re getting a good deal. So, what makes markets efficient? Decision Making: Groups Vs. Individuals At any given moment, a single person acting independently is capable of making an uninformed decision. Individuals are at a distinct disadvantage in the decision-making process because they often draw conclusions from their own limited set of data. Groups on the other hand, while still capable of exhibiting poor judgment, are less likely to make mistakes due to the benefits of collective brain power. You’ve probably heard the old adage a thousand times “two heads are better than one.” Financial markets operate on the same premise, acting at the will of millions of participants who make judgments through the active buying and selling of companies based upon massive quantities of information. In a sense, they’re voting with their dollars. The act of buying or selling effectively moves stock prices in one direction or another until it reaches an equilibrium. Therefore, the current price that a stock trades at should represent a good estimate of what that company is worth because it captures the sentiments of millions of buyers and sellers. The Judgment of the Masses is Hard to Beat. Markets don’t trade on yesterday’s information, or even today’s. Alternately, they look toward the future, and trade based on the collective masses interpretation of tomorrow’s value. So, if two heads are better than one, millions of heads are most assuredly better than two. This is the main reason why stock mispricings are so hard to identify. A speculator would have to believe that they know something that everyone else doesn’t already know about a company because the current stock price is a reflection of all voting participants, i.e buyers, and sellers. In a world where news travels at the speed of light, what are the chances of that? Even if they did know something, and for argument’s sake let’s say a speculator was in possession of information that wasn’t already reflected in prices. What are the chances they can act on this information fast enough to benefit from any price change? In a 24-hour news cycle, it’s hard to keep much of anything a secret. As word spreads, the value of information is depleted by the second. With instant access to breaking news in the palm of our hand, information has never been so readily available as it is today. Collectively, the way we interpret information empowers us to freely evaluate the value of things, including companies we choose to invest in. In most every instance investors should operate under the assumption that prices are fair and accurate. Markets work because they are a global reflection of what we think works. It will soon be the 10-year anniversary of when, in early October 2007, the S&P 500 Index hit what was its highest point before losing more than half its value over the next year and a half during the global financial crisis. Over the coming weeks and months, as other anniversaries of major crisis-related events pass (for example, 10 years since the bank run on Northern Rock or 10 years since the collapse of Lehman Brothers), there will likely be a steady stream of retrospectives on what happened as well as opinions on how the environment today may be similar or different from the period leading up to the crisis. It is difficult to draw useful conclusions based on such observations; financial markets have a habit of behaving unpredictably in the short run. There are, however, important lessons that investors might be well-served to remember: Capital markets have rewarded investors over the long term, and having an investment approach you can stick with—especially during tough times—may better prepare you for the next crisis and its aftermath. BENEFITS OF HINDSIGHT In 2008, the stock market dropped in value by almost half. Being a decade removed from the crisis may make it easier to take the past in stride. The eventual rebound and subsequent years of double-digit gains have also likely helped in this regard. While the events of the crisis were unfolding, however, a future of this sort looked anything but certain. Headlines such as “Worst Crisis Since ’30s, With No End Yet in Sight,”[1] “Markets in Disarray as Lending Locks Up,”[2] and “For Stocks, Worst Single-Day Drop in Two Decades”[3] were common front page news. Reading the news, opening up quarterly statements, or going online to check an account balance were, for many, stomach-churning experiences. While being an investor today (or during any period, for that matter), is by no means a worry-free experience, the feelings of panic and dread felt by many during the financial crisis were distinctly acute. Many investors reacted emotionally to these developments. In the heat of the moment, some decided it was more than they could stomach, so they sold out of stocks. On the other hand, many who were able to stay the course and stick to their approach recovered from the crisis and benefited from the subsequent rebound in markets. It is important to remember that this crisis and the subsequent recovery in financial markets was not the first time in history that periods of substantial volatility have occurred. Exhibit 1 helps illustrate this point. The exhibit shows the performance of a balanced investment strategy following several crises, including the bankruptcy of Lehman Brothers in September of 2008, which took place in the middle of the financial crisis. Each event is labeled with the month and year that it occurred or peaked. Exhibit 1. The Market’s Response to Crisis Performance of a Balanced Strategy: 60% Stocks, 40% Bonds (Cumulative Total Return) 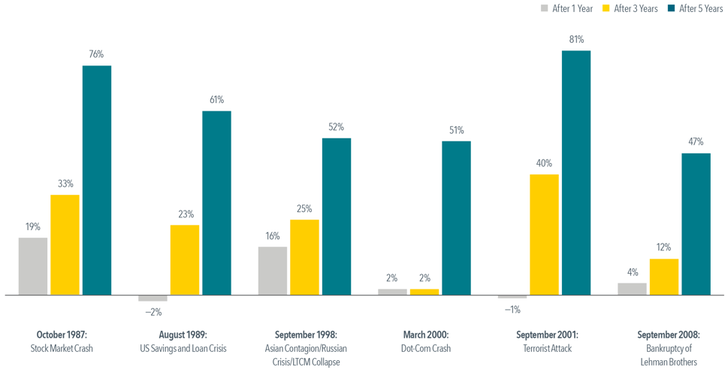 In US dollars. Represents cumulative total returns of a balanced strategy invested on the first day of the following calendar month of the event noted. Balanced Strategy: 12% S&P 500 Index,12% Dimensional US Large Cap Value Index, 6% Dow Jones US Select REIT Index, 6% Dimensional International Marketwide Value Index, 6% Dimensional US Small Cap Index, 6% Dimensional US Small Cap Value Index, 3% Dimensional International Small Cap Index, 3% Dimensional International Small Cap Value Index, 2.4% Dimensional Emerging Markets Small Index, 1.8% Dimensional Emerging Markets Value Index, 1.8% Dimensional Emerging Markets Index, 10% Bloomberg Barclays Treasury Bond Index 1-5 Years, 10% Citigroup World Government Bond Index 1-5 Years (hedged), 10% Citigroup World Government Bond Index 1-3 Years (hedged), 10% BofA Merrill Lynch 1-Year US Treasury Note Index. The S&P data are provided by Standard & Poor’s Index Services Group. The Merrill Lynch Indices are used with permission; copyright 2017 Merrill Lynch, Pierce, Fenner & Smith Incorporated; all rights reserved. Citigroup Indices used with permission, © 2017 by Citigroup. Bloomberg Barclays data provided by Bloomberg. For illustrative purposes only. Dimensional indices use CRSP and Compustat data. Indices are not available for direct investment. Their performance does not reflect the expenses associated with the management of an actual portfolio. Past performance is not a guarantee of future results. Not to be construed as investment advice. Rebalanced monthly. Returns of model portfolios are based on back-tested model allocation mixes designed with the benefit of hindsight and do not represent actual investment performance. See Appendix for additional information. Although a globally diversified balanced investment strategy invested at the time of each event would have suffered losses immediately following most of these events, financial markets did recover, as can be seen by the three- and five-year cumulative returns shown in the exhibit. In advance of such periods of discomfort, having a long-term perspective, appropriate diversification, and an asset allocation that aligns with their risk tolerance and goals can help investors remain disciplined enough to ride out the storm. A financial advisor can play a critical role in helping to work through these issues and in counseling investors when things look their darkest. CONCLUSION In the mind of some investors, there is always a “crisis of the day” or potential major event looming that could mean the beginning of the next drop in markets. As we know, predicting future events correctly, or how the market will react to future events, is a difficult exercise. It is important to understand, however, that market volatility is a part of investing. To enjoy the benefit of higher potential returns, investors must be willing to accept increased uncertainty. A key part of a good long-term investment experience is being able to stay with your investment philosophy, even during tough times. A well‑thought‑out, transparent investment approach can help people be better prepared to face uncertainty and may improve their ability to stick with their plan and ultimately capture the long-term returns of capital markets. APPENDIX
Balanced Strategy 60/40 The model’s performance does not reflect advisory fees or other expenses associated with the management of an actual portfolio. There are limitations inherent in model allocations. In particular, model performance may not reflect the impact that economic and market factors may have had on the advisor’s decision making if the advisor were actually managing client money. The balanced strategies are not recommendations for an actual allocation. International Value represented by Fama/French International Value Index for 1975–1993. Emerging Markets represented by MSCI Emerging Markets Index (gross dividends) for 1988–1993. Emerging Markets weighting allocated evenly between International Small Cap and International Value prior to January 1988 data inception. Emerging Markets Small Cap represented by Fama/French Emerging Markets Small Cap Index for 1989–1993. Emerging Markets Value and Small Cap weighting allocated evenly between International Small Cap and International Value prior to January 1989 data inception. Two-Year Global weighting allocated to One‑Year prior to January 1990 data inception. Five-Year Global weighting allocated to Five-Year Government prior to January 1990 data inception. For illustrative purposes only. The Dimensional Indices used have been retrospectively calculated by Dimensional Fund Advisors LP and did not exist prior to their index inceptions dates. Accordingly, results shown during the periods prior to each Index’s index inception date do not represent actual returns of the Index. Other periods selected may have different results, including losses. Index Descriptions Dimensional US Large Cap Value Index is compiled by Dimensional from CRSP and Compustat data. Targets securities of US companies traded on the NYSE, NYSE MKT (formerly AMEX), and Nasdaq Global Market with market capitalizations above the 1,000th‑largest company whose relative price is in the bottom 30% of the Dimensional US Large Cap Index after the exclusion of utilities, companies lacking financial data, and companies with negative relative price. The index emphasizes securities with higher profitability, lower relative price, and lower market capitalization. Profitability is measured as operating income before depreciation and amortization minus interest expense scaled by book. Exclusions: non-US companies, REITs, UITs, and investment companies. The index has been retroactively calculated by Dimensional and did not exist prior to March 2007. The calculation methodology for the Dimensional US Large Cap Value Index was amended in January 2014 to include direct profitability as a factor in selecting securities for inclusion in the index. Prior to January 1975: Targets securities of US companies traded on the NYSE, NYSE MKT (formerly AMEX), and Nasdaq Global Market with market capitalizations above the 1,000th‑largest company whose relative price is in the bottom 20% of the Dimensional US Large Cap Index after the exclusion of utilities, companies lacking financial data, and companies with negative relative price. Dimensional US Small Cap Index was created by Dimensional in March 2007 and is compiled by Dimensional. It represents a market‑capitalization‑weighted index of securities of the smallest US companies whose market capitalization falls in the lowest 8% of the total market capitalization of the Eligible Market. The Eligible Market is composed of securities of US companies traded on the NYSE, NYSE MKT (formerly AMEX), and Nasdaq Global Market. Exclusions: Non-US companies, REITs, UITs, and investment companies. From January 1975 to the present, the index also excludes companies with the lowest profitability and highest relative price within the small cap universe. Profitability is measured as operating income before depreciation and amortization minus interest expense scaled by book. Source: CRSP and Compustat. The index monthly returns are computed as the simple average of the monthly returns of 12 sub-indices, each one reconstituted once a year at the end of a different month of the year. The calculation methodology for the Dimensional US Small Cap Index was amended on January 1, 2014, to include profitability as a factor in selecting securities for inclusion in the index. Dimensional US Small Cap Value Index is compiled by Dimensional from CRSP and Compustat data. Targets securities of US companies traded on the NYSE, NYSE MKT (formerly AMEX), and Nasdaq Global Market whose relative price is in the bottom 35% of the Dimensional US Small Cap Index after the exclusion of utilities, companies lacking financial data, and companies with negative relative price. The index emphasizes securities with higher profitability, lower relative price, and lower market capitalization. Profitability is measured as operating income before depreciation and amortization minus interest expense scaled by book. Exclusions: non-US companies, REITs, UITs, and investment companies. The index has been retroactively calculated by Dimensional and did not exist prior to March 2007. The calculation methodology for the Dimensional US Small Cap Value Index was amended in January 2014 to include direct profitability as a factor in selecting securities for inclusion in the index. Prior to January 1975: Targets securities of US companies traded on the NYSE, NYSE MKT (formerly AMEX), and Nasdaq Global Market whose relative price is in the bottom 25% of the Dimensional US Small Cap Index after the exclusion of utilities, companies lacking financial data, and companies with negative relative price. Dimensional International Marketwide Value Index is compiled by Dimensional from Bloomberg securities data. The index consists of companies whose relative price is in the bottom 33% of their country’s companies after the exclusion of utilities and companies with either negative or missing relative price data. The index emphasizes companies with smaller capitalization, lower relative price, and higher profitability. The index also excludes those companies with the lowest profitability and highest relative price within their country’s value universe. Profitability is measured as operating income before depreciation and amortization minus interest expense scaled by book. Exclusions: REITs and investment companies. The index has been retroactively calculated by Dimensional and did not exist prior to April 2008. The calculation methodology for the Dimensional International Marketwide Value Index was amended in January 2014 to include direct profitability as a factor in selecting securities for inclusion in the index. Dimensional International Small Cap Index was created by Dimensional in April 2008 and is compiled by Dimensional. July 1981–December 1993: It Includes non-US developed securities in the bottom 10% of market capitalization in each eligible country. All securities are market capitalization weighted. Each country is capped at 50%. Rebalanced semiannually. January 1994–Present: Market-capitalization-weighted index of small company securities in the eligible markets excluding those with the lowest profitability and highest relative price within the small cap universe. Profitability is measured as operating income before depreciation and amortization minus interest expense scaled by book. The index monthly returns are computed as the simple average of the monthly returns of four sub-indices, each one reconstituted once a year at the end of a different quarter of the year. Prior to July 1981, the index is 50% UK and 50% Japan. The calculation methodology for the Dimensional International Small Cap Index was amended on January 1, 2014, to include profitability as a factor in selecting securities for inclusion in the index. [1]. wsj.com/articles/SB122169431617549947. [2]. washingtonpost.com/wp-dyn/content/article/2008/09/17/AR2008091700707.html. [3]. nytimes.com/2008/09/30/business/30markets.html. In the world of investment management there is an oft-discussed idea that blindfolded monkeys throwing darts at pages of stock listings can select portfolios that will do just as well, if not better, than both the market and the average portfolio constructed by professional money managers. If this is true, why might it be the case? The Dart Board Exhibit 1 shows the components of the Russell 3000 Index (regarded as a good proxy for the US stock market) as of December 31, 2016. Each stock in the index is represented by a box, and the size of each box represents the stock’s market capitalization (share price multiplied by shares outstanding) or “market cap” in the index. For example, Apple (AAPL) is the largest box since it has the largest market cap in the index. The boxes get smaller as you move from the top to the bottom of the exhibit, from larger stocks to smaller stocks. The boxes are also color coded based on their market cap and whether they are value or growth stocks. Value stocks have lower relative prices (as measured by, for instance the price-to-book ratio) and growth stocks tend to have higher relative prices. In the exhibit, blue represents large cap value stocks (LV), green is large cap growth stocks (LG), gray is small cap value stocks (SV), and yellow is small cap growth stocks (SG). For the purposes of this analogy you can think of Exhibit 1 as a proxy for the overall stock market and therefore similar to a portfolio that, in aggregate, professional money managers hold in their competition with their simian challengers. Because for every investor holding an overweight to a stock (relative to its market cap weighting) there must also be an investor underweight that same stock, this means that, in aggregate, the average dollar invested holds a portfolio that looks like the overall market.[1] Exhibit 1. US Stocks Sized by Market Capitalization 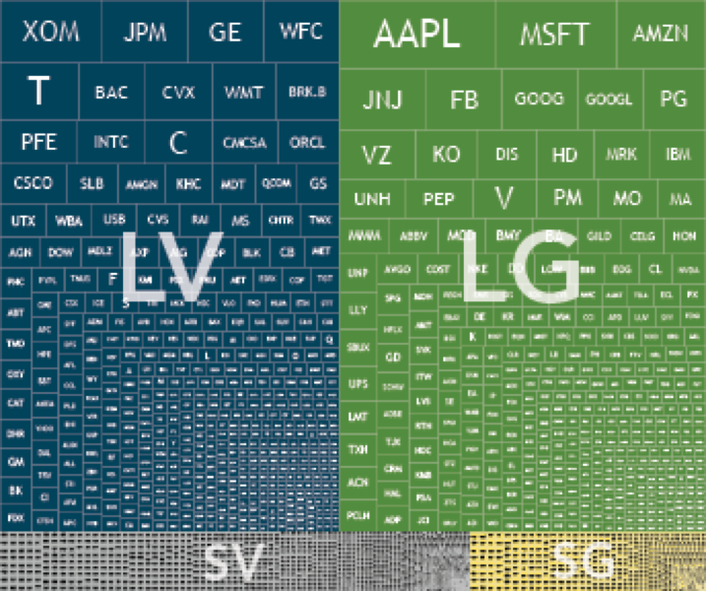 For illustrative purposes only. Illustration includes constituents of the Russell 3000 Index as of December 31, 2016, on a market-cap weighted basis segmented into Large Value, Large Growth, Small Value, and Small Growth. Source: Frank Russell Company is the source and owner of the trademarks, service marks, and copyrights related to the Russell Indexes. Please see Appendix for additional information. Exhibit 2, on the other hand, represents the dart board the monkeys are using to play their game. Here, the boxes represent the same stocks shown in Exhibit 1, but instead of weighting each company by market cap, the companies are weighted equally. For example, in this case, Apple’s box is the same size as every other company in the index regardless of its market cap. If one were to pin up pages of newspaper stock listings to throw darts at, Exhibit 2 would be much more representative of what the target would look like. When looking at Exhibits 1 and 2, the significant differences between the two are clear. In Exhibit 1, the surface area is dominated by large value and large growth (blue and green) stocks. In Exhibit 2, however, small cap value stocks dominate (gray). Why does this matter? Research has shown that, historically over time, small company stocks have had excess returns relative to large company stocks. Research has also shown that, historically over time, value (or low relative price) stocks have had excess returns relative to growth (or high relative price) stocks. Because Exhibit 2 has a greater proportion of its surface area dedicated to small cap value stocks, it is more likely that a portfolio of stocks selected at random by throwing darts would end up being tilted towards stocks which research has shown to have had higher returns when compared to the market. Exhibit 2. US Stocks Sized Equally  For illustrative purposes only. Illustration includes the constituents of the Russell 3000 Index as of December 31, 2016 on an equal-weighted basis segmented into Large Value, Large Growth, Small Value, and Small Growth. Source: Frank Russell Company is the source and owner of the trademarks, service marks, and copyrights related to the Russell Indexes. Please see Appendix for additional information. So…throw away? This does not mean, however, that haphazardly selecting stocks by the toss of a dart is an efficient or reliable way to invest. For one thing, it ignores the complexities that arise in competitive markets. Consider as an example something seemingly as straightforward as a strategy that holds every stock in the Russell 3000 Index at an equal weight (the equivalent of buying the whole dart board in Exhibit 2). In order to maintain an equal weight in all 3,000 securities, an investor would have to rebalance frequently, buying shares of companies that have gone down in price and selling shares that have gone up. This is because as prices change, so will each individual holding’s respective weight in the portfolio. By not considering whether or not these frequent trades add value over and above the costs they generate, investors are opening themselves up to a potentially less than desirable outcome. Instead, if there are well-known relationships that explain differences in expected returns across stocks, using a systematic and purposeful approach that takes into consideration real-world constraints is more likely to increase your chances for investment success. Considerations for such an approach include things like: understanding the drivers of returns and how to best design a portfolio to capture them, what a sufficient level of diversification is, how to appropriately rebalance, and last but not least, how to manage the costs associated with pursuing such a strategy. The Long Game Finally, the importance of having an asset allocation well suited for your objectives and risk tolerance, as well as being able to remain focused on the long term, cannot be overemphasized. Even well-constructed portfolios pursuing higher expected returns will have periods of disappointing results. A financial advisor can help an investor decide on an appropriate asset allocation, stay the course during periods of disappointing results, and carefully weigh the considerations mentioned above to help investors decide if a given investment strategy is the right one for them. Conclusion So what insights can investors glean from this analysis? First, by tilting a portfolio towards sources of higher expected returns, investors can potentially outperform the market without needing to outguess market prices. Second, implementation and patience are paramount. If one is going to pursue higher expected returns, it is important to do so in a cost-effective manner and to stay focused on the long term. Appendix: Large cap is defined as the top 90% of market cap (small cap is the bottom 10%), while value is defined as the 50% of market cap of the lowest relative price stocks (growth is the 50% of market cap of the highest relative price stocks). For educational and informational purposes only and does not constitute a recommendation of any security. The determinations of Large Value, Large Growth, Small Value, and Small Growth do not represent any determinations Dimensional Fund Advisors may make in assessing any of the securities shown. [1]. For more on this concept, please see “The Arithmetic of Active Management” by William Sharpe. By now most informed investors are at the very least aware of the rationale behind index investing. It’s a simple argument really. Thanks to millions of buyers and sellers the market does a good job of translating information into prices. Indexers stay on the bench because they know the perils of playing the “find the next best stock” game. The evidence for buying and holding the index vs. attempting to beat it is long and well founded. There’s nothing new to this argument and maybe that’s the point. It’s been made for over 40 years. Vanguard founder John Bogle is perhaps the most vocal and consistent messenger. In fact, I might argue that he’s saved investors more money than any single financial persona in history due to the size and scope of the company he built. Here’s the problem. Few index investors understand that the same academics responsible for its groundbreaking research, see it as the maiden version of factor based investing. In the scientific community Eugene Fama is revered as the father of modern day finance. He won the Nobel prize in 2013, but he’s still probably not what you would consider a household name. His seminal work on market efficiency laid the foundation for the main argument that index investors make daily “It’s hard to beat the market…So just own it.  When compared to other scientific areas of study, it’s fair to say that modern day financial science is a newer discipline, coming of age when we first began tracking securities prices with the help of computers. The discovery that stock prices tend to follow a random walk theory, moving independent of trends, may have been one of the first transcendent ideas to come from this research. Now, over 50 years later we know much more about empirical factors that help to explain where investment returns come from.
In 1992 Fama, along with colleague Kenneth French went on to publish one of the most widely sourced academic papers in all of finance. The “Fama-French Three Factor Model” documented the historical evidence behind the tendencies for stocks to outperform bonds, small companies to outperform large companies and value companies to outperform growth companies. Since then, academia has continuously searched to identify ways to improve upon what we already know about the movement of prices. Momentum and other factors that have rigorous academic backing embody these efforts. In 2017 “objectivity” is the common buzzword that gets thrown around all too lightly. Choosing to build a market cap weighted index portfolio doesn’t strike me as an objective approach to portfolio management given the decades of research compiled since the efficient markets hypothesis. Evidence and research aside, that doesn’t mean all strategies are created equal. The financial industry hasn’t done investors a lot of favors with the marketing of factor based investing and maybe that’s the reason it’s so grossly misunderstood. Smart beta, active indexing, and fundamental indexing are just a few of the invented alias’s. Any fund or strategy claiming the backing of empirical research should be carefully vetted for how the factor/factors are being targeted, fees and also how its inclusion interacts with the rest of the portfolio. It’s not bad or wrong to simply own the market, but I would argue that if you believe in index investing, you should believe in factor based investing if for no other reason than the initial architects of such research do. It represents the best empirical understanding we have of what drives investment performance. Should stock investors worry about changes in interest rates? Research shows that, like stock prices, changes in interest rates and bond prices are largely unpredictable.[1] It follows that an investment strategy based upon attempting to exploit these sorts of changes isn’t likely to be a fruitful endeavor. Despite the unpredictable nature of interest rate changes, investors may still be curious about what might happen to stocks if interest rates go up. Unlike bond prices, which tend to go down when yields go up, stock prices might rise or fall with changes in interest rates. For stocks, it can go either way because a stock’s price depends on both future cash flows to investors and the discount rate they apply to those expected cash flows. When interest rates rise, the discount rate may increase, which in turn could cause the price of the stock to fall. However, it is also possible that when interest rates change, expectations about future cash flows expected from holding a stock also change. So, if theory doesn’t tell us what the overall effect should be, the next question is what does the data say? Recent Research Recent research performed by Dimensional Fund Advisors helps provide insight into this question.[2] The research examines the correlation between monthly US stock returns and changes in interest rates.[3] Exhibit 1 shows that while there is a lot of noise in stock returns and no clear pattern, not much of that variation appears to be related to changes in the effective federal funds rate.[4] Exhibit 1. Monthly US Stock Returns against Monthly Changes in Effective Federal Funds Rate, August 1954–December 2016 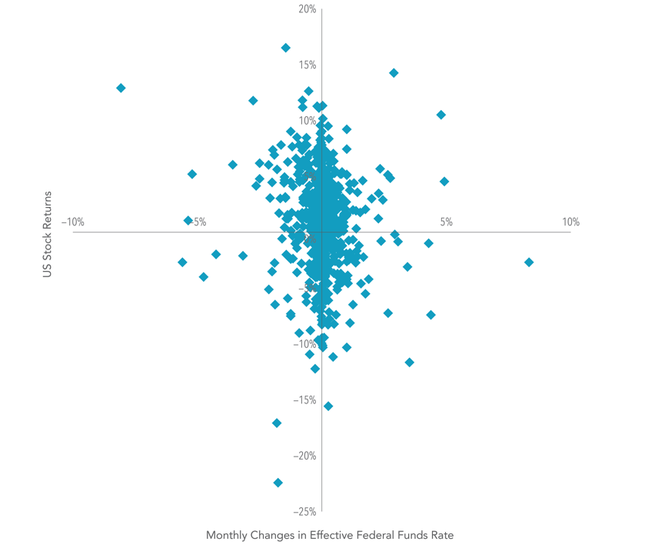 Monthly US stock returns are defined as the monthly return of the Fama/French Total US Market Index and are compared to contemporaneous monthly changes in the effective federal funds rate. Bond yield changes are obtained from the Federal Reserve Bank of St. Louis. For example, in months when the federal funds rate rose, stock returns were as low as –15.56% and as high as 14.27%. In months when rates fell, returns ranged from –22.41% to 16.52%. Given that there are many other interest rates besides just the federal funds rate, Dai also examined longer-term interest rates and found similar results. So to address our initial question: when rates go up, do stock prices go down? The answer is yes, but only about 40% of the time. In the remaining 60% of months, stock returns were positive. This split between positive and negative returns was about the same when examining all months, not just those in which rates went up. In other words, there is not a clear link between stock returns and interest rate changes. Conclusion There’s no evidence that investors can reliably predict changes in interest rates. Even with perfect knowledge of what will happen with future interest rate changes, this information provides little guidance about subsequent stock returns. Instead, staying invested and avoiding the temptation to make changes based on short-term predictions may increase the likelihood of consistently capturing what the stock market has to offer. Glossary
Discount Rate: Also known as the “required rate of return,” this is the expected return investors demand for holding a stock. Correlation: A statistical measure that indicates the extent to which two variables are related or move together. Correlation is positive when two variables tend to move in the same direction and negative when they tend to move in opposite directions. Index Descriptions Fama/French Total US Market Index: Provided by Fama/French from CRSP securities data. Includes all US operating companies trading on the NYSE, AMEX, or Nasdaq NMS. Excludes ADRs, investment companies, tracking stocks, non-US incorporated companies, closed-end funds, certificates, shares of beneficial interests, and Berkshire Hathaway Inc. (Permco 540). Source: Dimensional Fund Advisors LP. Results shown during periods prior to each Index’s index inception date do not represent actual returns of the respective index. Other periods selected may have different results, including losses. Backtested index performance is hypothetical and is provided for informational purposes only to indicate historical performance had the index been calculated over the relevant time periods. Backtested performance results assume the reinvestment of dividends and capital gains. Eugene Fama and Ken French are members of the Board of Directors for and provide consulting services to Dimensional Fund Advisors LP. There is no guarantee investment strategies will be successful. Investing involves risks including possible loss of principal. All expressions of opinion are subject to change. This article is distributed for informational purposes, and it is not to be construed as an offer, solicitation, recommendation, or endorsement of any particular security, products, or services. [1]. See, for example, Fama 1976, Fama 1984, Fama and Bliss 1987, Campbell and Shiller 1991, and Duffee 2002. [2]. Wei Dai, “Interest Rates and Equity Returns” (Dimensional Fund Advisors, April 2017). [3]. US stock market defined as Fama/French Total US Market Index. [4]. The federal funds rate is the interest rate at which depository institutions lend funds maintained at the Federal Reserve to another depository institution overnight. For decades we’ve known about the existence of factors that help to explain expected investment return. “Factor based investing” isn’t a new concept, but it is new to many investors. For one reason or another the terminology, which is widely recognized in financial academia, struggled to find mainstream adoption. Now, for the first time things are beginning to change. Unlike the relentless stream of jargon invented by the financial industry, factor based investing describes an investment approach that’s grounded in science, as opposed to many others which are created to support Wall Street sales pitches. The easiest way to understand factor based investing is to first think about investment management in a very basic sense of either passive or active. The two styles occupy separate ends of a decision spectrum which represents not only the level of activity, but also the type of activity. Factor based investing really sits at the intersection of passive and active management, but in order to truly understand it, we must further define the opposite ends of the spectrum. Pure Passive Index Investing A pure passive approach applies the most simplistic form of expected return predictability. The goal is to closely track the market index in order to replicate its performance while mitigating as many fees as possible throughout the process. Basically, buy it and hold it forever with virtually no activity or human intervention. The predominant passive indexing approach used today hasn’t evolved much over the last 40 years. Market cap weighting or cap weighted indexing assigns a company’s exposure in the index by its overall size in the marketplace. The number of outstanding shares times the share price gives us a company’s market cap, which is then used to determine what % of exposure it gets in the index. Therefore, the largest companies have a bigger impact on index performance than the smallest. For example: The S&P 500 index represents that largest 500 companies in the United States. Apple is just one company yet; it accounts for nearly 4% of the index. Conventional Active Investing Historically, we think about active investing in the context of predicting stock or asset class behavior based upon a number of fundamental or technical indicators. This type of forecasting places a high level of subjectivity in the hands of managers who are charged with making decisions that add value (or alpha as it’s known in the industry), above and beyond what the investor could have received had they invested in the passive index. The managers goal is to outperform. Doing so over long periods of time usually results in a fair amount of stardom and large fund inflows coming from return chasing investors. 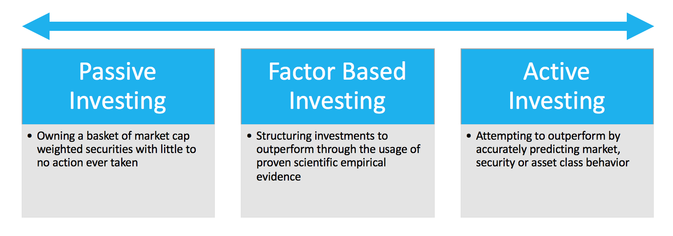 Passive index style investing has seen a significant popularity growth in recent years largely due to the evidence suggesting a failure of speculative active managers. Yet, it’s inaccurate to portray inactivity as a sound investment strategy based on this fact alone. Our understanding of capital markets and the factors that explain investment return has evolved significantly since the advent of index investing over 40 years ago. Every time a decision is made to adjust a portfolio in some way, even if the decision is to simply rebalance, the investor makes an active decision to move away from the pure passive end of the management spectrum. Factor Based Investing Factor based investing seeks to answer the question: What are the INTELLIGENT active and passive decisions that can be made to improve the risk/return profile of a portfolio? This is where financial science comes in. Factor based investors believe in making decisions based on the evidence reflected in large amounts of historical data. The conventional active investor believes in the possession of a superior skill or intellect which can be used to outsmart the market by seeing things others have missed. The issue with a conventional active approach is that at some stage in the decision making process, the outcome must be interpreted as a reasonable guess, hunch, or gut feeling. In contrast, a factor based approach is always able to reference the historical data and only the data as evidence of rational, thereby removing much of the subjective human element from the decision making process. Factor based investing positively pulls from both active and passive sides of the spectrum. Like passive, it strongly agrees with the idea that attempting to time the market is routinely impossible. Unlike a pure passive indexing, factor based investing recognizes the evolution in our understanding of capital markets and factors that help to explain investment returns. Thus, it actively structures investments in the optimal way to compensate investors for taking risks that are historically worth taking. The supporting evidence Factors such as the following help to explain the reward investors receive for the amount of exposure they maintain to the MARKET as a whole, VALUE companies, SMALL companies and HIGH PROFITABILITY companies. The data going as far back as the 1920’s is reveals these effects which exist not only in domestic markets as listed below, but also across geography and asset classes around the globe. As time elapses over different 1,5,10 and 15 year periods, we begin to see the undeniable effect. Historical Performance of Factors over Rolling Periods 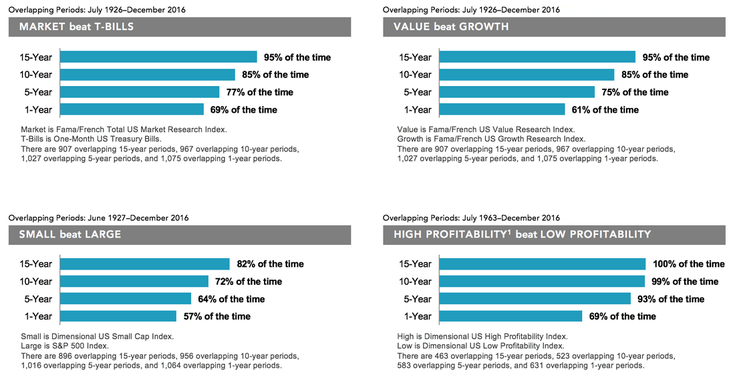 These examples make a strong case for structuring portfolios in a manner to target some specific factors. However, one point that’s often left out of the discussion is the importance of diversification. If the research is interpreted to suggest that due to the historical likelihood of value stocks outperforming growth and small to outperform large, a portfolio should therefore ONLY own small and value companies, it has been sorely misinterpreted. The diversification benefits of owning a large number of companies which fall across the growth, value and size spectrum, in addition to fixed income is of critical importance to most investors in order to reduce overall portfolio volatility. Research Pioneers In its purest form factor based investing holds true to objective ongoing research that turns a blind eye to the name or even reputation of any single company. Pioneers of this movement such as Nobel Laureates Harry Markowitz, William Sharpe, Eugene Fama and Kenneth French are unlikely household names to the average investor, but they’re undoubtedly giants of modern finance. They, along with forward thinking industry titans like Vanguard’s Jack Bogle and Dimensional Fund Advisor’s David Booth have helped make the practical application of empirical research possible. 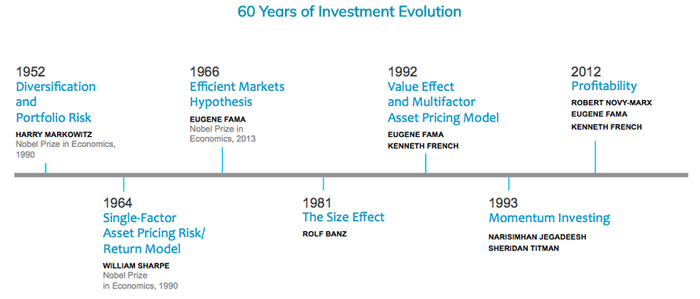 The current level of activity and new product development has never been higher. Perhaps the most important thing to understand about factor based investing is that today’s research stands on the shoulders of yesterday. “Eureka” moments are few and far between with most new developments coming in the form incremental improvements to well-founded ideas. I would issue a word of caution, and even a healthy level of skepticism of the financial industry which regularly rushes products to market, citing new research, without fully understanding its validity. Remember, Nobel Prizes don’t grow on trees. Factor based investing isn’t purely active and it isn’t purely passive but a marriage of intelligent research backed ideas from both disciplines. It’s about taking what financial science has given us, evaluating the strongest ideas and filtering through thousands of solutions to find the best translation of those ideas. It used to be a strategy reserved only for the wealthy sophisticated few. Today, I can proudly say that with the help of firms like WealthShape investors from all walks of life have access to evidence based investment solutions that are built on reason, not speculation. *Historical Performance of Factors over Rolling Time Periods Information provided by Dimensional Fund Advisors LP. Indices are not available for direct investment. Past performance is not a guarantee of future results.1. Profitability is a measure of current profitability, based on information from individual companies’ income statements. In US dollars. Based on rolling annualized returns using monthly data. Rolling multiyear periods overlap and are not independent. This statistical dependence must be considered when assessing the reliability of long-horizon return differences. “One-Month Treasury Bills” is the IA SBBI US 30 Day TBill TR USD, provided by Ibbotson Associates via Morningstar Direct. Dimensional Index data compiled by Dimensional. Fama/French data provided by Fama/French. The S&P data is provided by Standard & Poor's Index Services Group. Eugene Fama and Ken French are members of the Board of Directors for and provide consulting services to Dimensional Fund Advisors LP. Index descriptions available upon request. This post comes from our friends at Dimensional. It takes an in-depth look at the profitability factor and the cutting edge empirical research we live by. Be advised: It's a bit heavy on investment terminology. However, it does contain a glossary. Since the 1950s, there have been numerous breakthroughs in the field of financial economics that have benefited both society and investors. One early example, resulting from research in the 1950s, is the insight that diversification can increase an investor’s wealth. Another example, resulting from research in the 1960s, is that market prices contain up-to-the-minute, relevant information about an investment’s expected return and risk. This means that market prices provide our best estimate of a security’s value. Seeking to outguess market prices and identify over- and undervalued securities is not a reliable way to improve returns. This long history of innovation in research continues into the present day. As academics and market participants seek to better understand security markets, insights from their research can enable investors to better pursue their investment goals. In this article, we will focus on a series of recent breakthroughs into the relation between a firm’s profitability and its stock returns. As we will see, an important insight Dimensional drew from this research is how profitability and market prices can be used to increase the expected returns of a stock portfolio without having to attempt to outguess market prices. DIFFERENCES IN EXPECTED RETURNS The price of a stock depends on a number of variables. For example, one variable is what a company owns minus what it owes (also called book value of equity). Expected profits, and the discount rate investors apply to these profits, are others. This discount rate is the expected return investors demand for holding the stock. The impact of market participants trading stocks is that market prices quickly find an equilibrium point where the expected return of a stock is commensurate with what investors demand. Decades of theoretical and empirical research have shown that not all stocks have the same expected return. Stated simply, investors demand higher returns to hold some stocks and lower returns to hold others. Given this information, is there a systematic way to identify those differences? OBSERVING THE UNOBSERVABLE: CURRENT AND FUTURE PROFITABILITY Market prices and expected future profits contain information about expected returns. While we can readily observe market prices as stocks are traded (think about a ticker tape scrolling across a television screen), we cannot observe market expectations for future profits or future profitability, which is profits divided by book value. So how can we use an unobserved variable to tell us about expected returns? A paper by Professors Eugene Fama and Kenneth French published in 2006[1] tackles this problem. Fama and French have authored more than 160 papers. They both rank within the top 10 most-cited fellows of the American Finance Association[2] and in 2013, Fama received a Nobel Prize in Economics Science for his work on securities markets. Fama and French explored which financial data that is observable today contain information about expected future profitability. They found that a firm’s current profitability contains information about its profitability many years hence. What insights did Dimensional glean from this? Current profitability contains information about aggregate investor’s expectations of future profitability. MEASURING PROFITABILITY The next academic breakthrough on profitability research was done by Professor Robert Novy-Marx, a world-renowned expert on empirical asset pricing. Building on the work of Fama and French, he explored the relation of different measures of current profitability to stock returns. Profits equal revenues minus expenses. One particularly important insight Dimensional took from Novy-Marx’s work is that not all current revenues and expenses have information about future profits. For example, firms sometimes call a revenue or expense “extraordinary” when they do not expect it to recur in the future. If those revenues or expenses are not expected to recur, should investors expect them to contain information about future profitability? Probably not. This is what Novy-Marx found when conducting his research. In a paper published in 2013,[3] he used US data since the 1960s and a measure of current profitability that excluded some non-recurring costs so that it could be a better estimate for expected future profitability. In doing so, he was able to document a strong relation between current profitability and future stock returns. That is, firms with higher profitability tended to have higher returns than those with low profitability. This is referred to as a profitability premium. Around the same time, the Research team at Dimensional was also conducting research into profitability. They extended the work of Fama and French and found that in developed and emerging markets globally, current profitability has information about future profitability and that firms with higher profitability have had higher returns than those with low profitability. They also found that this observation held true when using different ways of measuring current profitability. These robustness checks are important to show that the profitability premiums observed in the original studies were not just due to chance. Their research indicated that when using current profitability to increase the expected returns of a real-world strategy, it is important to have a thoughtful measure of profitability that provides a complete picture of a firm’s expenses while excluding revenues and expenses that may be unusual and therefore not expected to persist in the future. THE CUTTING EDGE: NEW RESEARCH Many papers documenting profitability premiums globally have been written since 2013. An exciting forthcoming paper[4] by Professor Sunil Wahal provides powerful out-of-sample US evidence of profitability premiums. Wahal is an expert in market microstructure (how stocks trade) and empirical asset pricing. Fama, French, and Novy-Marx’s research on profitability used US data from 1963 on. Why? Because when they conducted their research, reliable machine-readable accounting statement data required to compute profitability for US stocks was only available from 1963 on. Hand-collecting and cleaning accounting statement data and then transcribing it in a reliable fashion is no easy task and presents many a challenge for any researcher. Wahal rose to those challenges. He gathered a team of research assistants to hand-collect accounting statement data from Moody’s Manuals from 1940 to 1963. By applying his (and his team’s) expertise in accounting, combined with a great deal of meticulous data checking, Wahal was able to produce reliable profitability data for all US stocks from 1940 to 1963. Using this data to measure the return differences between stocks with high vs. low profitability, Wahal found similar differences in returns to what had been found in the post-1963 period. This research provides compelling evidence of the profitability premium pre-1963 and is a powerful out-of-sample test that strengthens the results found in earlier work. THE SIZE OF THE PROFITABILITY PREMIUM So how large has the profitability premium been historically? Large enough that investors who want to increase expected returns in a systematic way should take note. Exhibit 1 shows empirical evidence of the profitability premium in the US and globally. In the US, between 1964 and 2016, the Dimensional US High Profitability Index and the Dimensional US Low Profitability Index had annualized compound returns of 12.55% and 8.23%, respectively. The difference between these figures, 4.32%, is a measure of the realized profitability premium in the US over the corresponding time period. The non-US developed market realized profitability premium was 4.51% between 1990 and 2016. In emerging markets, the realized profitability premium was 5.21% between 1996 and 2016. Exhibit 1. The Profitability Premium 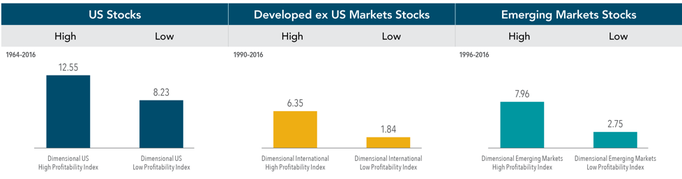 Profitability is measured as operating income before depreciation and amortization minus interest expense scaled by book. Indices are not available for direct investment. Their performance does not reflect the expenses associated with the management of an actual portfolio. Past performance is not a guarantee of future results. Index returns are not representative of actual portfolios and do not reflect costs and fees associated with an actual investment. Actual returns may be lower. See “Index Descriptions” in the appendix for descriptions of Dimensional and Fama/French index data. Eugene Fama and Ken French are members of the Board of Directors for and provide consulting services to Dimensional Fund Advisors LP. CONCLUSION In summary, there are differences in expected returns across stocks. Variables that tell us what an investor has to pay (market prices) and what they expect to receive (book equity and future profits) contain information about those expected returns. All else equal, the lower the price relative to book value and the higher the expected profitability, the higher the expected return. What Dimensional has learned from its own work and the work of Professors Fama, French, Novy-Marx, and Wahal, as well as others, is that current profitability has information about expected profitability. This information can be used in tandem with variables like market capitalization or price-to-book ratios to extract the differences in expected returns embedded in market prices. As such, it allows investors to increase the expected return potential of their portfolio without trying to outguess market prices. GLOSSARY Book Value of Equity: The value of stockholder’s equity as reported on a company’s balance sheet. Discount Rate: Also known as the “required rate of return” this is the expected return investors demand for holding a stock. Out-of-sample: A time period not included or directly examined in the data series used in a statistical analysis. Market Microstructure: The examination of how markets function in a fine level of detail, this can include areas of inquiry such as: how traders interact, how security orders are placed and cleared and how information is relayed and priced. Empirical Asset Pricing: A field of study that uses theory and data to understand how assets are priced. Profitability Premium: The return difference between stocks of companies with high profitability over those with low profitability. Realized Profitability Premium: The realized, or actual, return difference in a given time period between stocks of companies with high profitability over those with low profitability. Index descriptions Dimensional US Low Profitability Index was created by Dimensional in January 2014 and represents an index consisting of US companies. It is compiled by Dimensional. Dimensional sorts stocks into three profitability groups from high to low. Each group represents one-third of the market capitalization. Similarly, stocks are sorted into three relative price groups. The intersections of the three profitability groups and the three relative price groups yield nine subgroups formed on profitability and relative price. The index represents the average return of the three low-profitability subgroups. It is rebalanced twice per year. Profitability is measured as operating income before depreciation and amortization minus interest expense scaled by book. Source: CRSP and Compustat. Dimensional US High Profitability Index was created by Dimensional in January 2014 and represents an index consisting of US companies. It is compiled by Dimensional. Dimensional sorts stocks into three profitability groups from high to low. Each group represents one-third of the market capitalization. Similarly, stocks are sorted into three relative price groups. The intersections of the three profitability groups and the three relative price groups yield nine subgroups formed on profitability and relative price. The index represents the average return of the three high-profitability subgroups. It is rebalanced twice per year. Profitability is measured as operating income before depreciation and amortization minus interest expense scaled by book. Source: CRSP and Compustat. Dimensional International Low Profitability Index was created by Dimensional in January 2013 and represents an index consisting of non-US developed companies. It is compiled by Dimensional. Dimensional sorts stocks into three profitability groups from high to low. Each group represents one-third of the market capitalization of each eligible country. Similarly, stocks are sorted into three relative price groups. The intersections of the three profitability groups and the three relative price groups yield nine subgroups formed on profitability and relative price. The index represents the average return of the three low-profitability subgroups. The index is rebalanced twice per year. Profitability is measured as operating income before depreciation and amortization minus interest expense scaled by book. Source: Bloomberg. Dimensional International High Profitability Index was created by Dimensional in January 2013 and represents an index consisting of non-US developed companies. It is compiled by Dimensional. Dimensional sorts stocks into three profitability groups from high to low. Each group represents one-third of the market capitalization of each eligible country. Similarly, stocks are sorted into three relative price groups. The intersections of the three profitability groups and the three relative price groups yield nine subgroups formed on profitability and relative price. The index represents the average return of the three high-profitability subgroups. The index is rebalanced twice per year. Profitability is measured as operating income before depreciation and amortization minus interest expense scaled by book. Source: Bloomberg. Dimensional Emerging Markets Low Profitability Index was created by Dimensional in April 2013 and represents an index consisting of emerging markets companies and is compiled by Dimensional. Dimensional sorts stocks into three profitability groups from high to low. Each group represents one-third of the market capitalization of each eligible country. Similarly, stocks are sorted into three relative price groups. The intersections of the three profitability groups and the three relative price groups yield nine subgroups formed on profitability and relative price. The index represents the average return of the three low-profitability subgroups. The index is rebalanced twice per year. Profitability is measured as operating income before depreciation and amortization minus interest expense scaled by book. Source: Bloomberg. Dimensional Emerging Markets High Profitability Index was created by Dimensional in April 2013 and represents an index consisting of emerging markets companies and is compiled by Dimensional. Dimensional sorts stocks into three profitability groups from high to low. Each group represents one-third of the market capitalization of each eligible country. Similarly, stocks are sorted into three relative price groups. The intersections of the three profitability groups and the three relative price groups yield nine subgroups formed on profitability and relative price. The index represents the average return of the three high-profitability subgroups. The index is rebalanced twice per year. Profitability is measured as operating income before depreciation and amortization minus interest expense scaled by book. Source: Bloomberg. Source: Dimensional Fund Advisors LP.There is no guarantee investment strategies will be successful. Diversification does not eliminate the risk of market loss. All expressions of opinion are subject to change. This article is distributed for informational purposes, and it is not to be construed as an offer, solicitation, recommendation, or endorsement of any particular security, products, or services.
Eugene Fama is a member of the Board of Directors for and provides consulting services to Dimensional Fund Advisors LP. He is a professor of finance at the University of Chicago, Booth School of Business. In 2013, he received a Nobel Prize for his work on securities markets. Ken French is a member of the Board of Directors for and provides consulting services to Dimensional Fund Advisors LP. He is a professor of finance at the Tuck School of Business at Dartmouth College. Robert Novy-Marx provides consulting services to Dimensional Fund Advisors LP. He is a professor of finance at the University of Rochester, Simon Business School. Sunil Wahal provides consulting services to Dimensional Fund Advisors LP. He is a professor of finance at Arizona State University, Carey School of Business. [1]. Eugene Fama and Kenneth French, “Profitability, Investment, and Average Returns,” Journal of Financial Economics, vol. 82 (2006), 491–518. [2]. G. William Schwert and Renè Stulz, “Gene Fama’s Impact: A Quantitative Analysis,” (working paper, Simon Business School, 2014, No. FR 14-17). [3]. Robert Novy-Marx, “The Other Side of Value: The Gross Profitability Premium,” Journal of Financial Economics, vol. 108 (2013), 1–28. [4]. Sunil Wahal, “The Profitability and Investment Premium: Pre-1963 Evidence,” (December 29, 2016). Available at SSRN: ssrn.com/abstract=2891491. |
|
Phone: 860-837-0303
|
Message: [email protected]
|
|
WINDSOR
360 Bloomfield Ave 3rd Floor Windsor, CT 06095 |
WEST HARTFORD
15 N Main St #100 West Hartford, CT 06107 |
SHELTON
One Reservoir Corporate Centre 4 Research Dr - Suite 402 Shelton, CT 06484 |
ROCKY HILL
175 Capital Boulevard 4th Floor Rocky Hill, CT 06067 |
Home I Who We Are I How We Invest I Portfolios I Financial Planning I Financial Tools I Wealth Management I Retirement Plan Services I Blog I Contact I FAQ I Log In I Privacy Policy I Regulatory & Disclosures

|

|

|
|

|

|

|
© 2024 WealthShape. All rights reserved.